The GOLD / SILVER RATIO rose from near 2-month lows in London trade on Monday as both metals fell against a rising Dollar after new US data beat analyst forecasts.
With manufacturing activity and sales of existing homes both stronger than Wall Street predicted, world stock markets held flat as falling bond prices saw the yield on 10-year US Treasury debt rise near 4-year highs at 2.98%.
Silver prices erased all of last week’s 2.8% gain by mid-afternoon in London, trading back down at $16.65 as gold fell to 2-week lows of $1323 per ounce.
That pushed up the Gold/Silver Ratio of the two precious metals’ relative prices, with one ounce of gold equal to 79.5 ounces of silver.
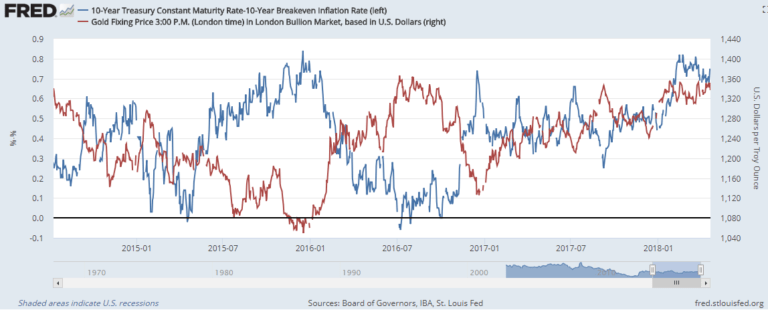
“Higher real [interest] rates have not always resulted in negative gold returns,” says analysis from the mining-backed World Gold Council today, pointing to a “waning” correlation between gold prices and bond yields adjusted for inflation expectations, while “the US Dollar is again [becoming] a stronger indicator of the direction of price.”

Based on monthly returns since 1971, the WGC finds that gold prices have risen twice as much during weak Dollar periods than they fell when the Dollar rose, adding 1.5% on average versus a weaker USD but losing only 0.7% against the greenback when it strengthened.
“Weaker USD and [investors] hedging tail risks [are] supportive, but easing geopolitics [make] price risk broadly balanced,” says a precious metals note from analyst Robin Bhar at French investment and London market-making bank Societe Generale.
“More downside than upside potential,” says the SocGen note of gold, silver and platinum, with palladium “the [only] highlight from a range bound complex – buy the dips.”
Net of bearish bets, the position of hedge funds and other money managers on Comex gold futures and options last week grew to the most bullish since end-March.
Rising to the equivalent of 446 tonnes of notional gold, it was one-eighth greater than the ‘Managed Money’s average net speculative long position of the last 10 years.
Betting on silver prices in contrast stayed negative among money managers for the 10th week running, now the longest stretch since current records began in 2006.
Rising again after falling from 2-year highs when silver prices jumped last week, the Gold/Silver Ratio has risen 81% of the time that silver has fallen on a 1-month basis since 1968.
“Gold failed at resistance [around] $1355 and the 100-day moving average might be the first support level at $1328,” said a brief technical analysis from the trading desk of Belgian refinery group Umicore Monday morning.
Silver “[has] found buyers once again below $17,” says a trading note from Swiss refining and finance group MKS Pamp.
“Gold should find support at the April lows around $1321.”