RSS

What's New

Stay up to date with gold, silver and platinum news, market developments and bullion insights.
Explore our latest articles or browse the archives to revisit the events that have shaped precious metal markets over the years.

Gold Hits 2013 Crash Low On ETF Sell Off As Dollar Hits 13 Year High

GOLD BULLION fell through its $1200 floor of the last 9 months Wednesday lunchtime in London, losing 2.4% before steadying just above $1180 per ounce – the bottom of its 2013 price crash – as the biggest jump in 2 years in reported US orders for durable goods saw the Dollar hit fresh 13-year highs on the currency market.

European stock markets cut their earlier losses as US equities held just shy of new record highs. Commodities also regained a drop – with crude oil reversing a 1% fall – after the Census Bureau said orders for ‘white goods’ such as freezers and washing machines jumped 4.8% last month from September, the fastest rise since summer 2014.

Sales of new homes fell however to a 4-month low, separate figures showed. Last week’s claims for US jobless benefits rose ahead of Wall Street forecasts.

All major government bond prices fell meantime, driving 10-year US Treasury yields up to 2.41%, a new 2016 high, as the Euro currency fell to new 2016 lows near $1.05 on the FX market.

That curbed the drop in Euro gold prices to a 6-week low, down 1.9% for the day at €1122 per ounce.

But priced in Dollars gold fell as low as $1182 per ounce – some $30 down from the start of London bullion trading – just near its ‘double bottom’ at $1180 of the 2013 crash, when bullion suffered its worst drop in three decades.

Chart of the Dollar gold price, last 5 years

Silver fell slightly less, cutting its 2016 gain to 19% at $16.40 per ounce – down from a two-year high above $21 in early July.

“Gold has arguably done well to hold on to the $1200 level,” said a note from bullion clearing bank ICBC Standard’s Tom Kendall earlier – “admittedly by its fingertips.”

But with all financial markets likely to see lower trading volumes ahead of the US Thanksgiving holiday tomorrow, “If you were inclined to test [that level], the reduced liquidity with US traders absent would be an obvious opportunity.

“It really does depend on the Dollar…and that big figure for gold may be tested before the turkeys are cooked.”

“Momentum and [moving average] indicators are bearish,” said Tuesday night’s technical analysis from fellow London bullion bank Scotia, “and risk remains to the downside.”

Tuesday saw the 9th successive outflow of bullion needed to back the SPDR Gold Trust (NYSEArca:GLD), the longest such stretch since gold’s 25% price plunge of April to June 2013.

Disclaimer

This publication is for education purposes only and should not be considered either general of personal advice. It does not consider any particular person’s investment objectives, financial situation or needs. Accordingly, no recommendation (expressed or implied) or other information contained in this report should be acted upon without the appropriateness of that information having regard to those factors. You should assess whether or not the information contained herein is appropriate to your individual financial circumstances and goals before making an investment decision, or seek the help the of a licensed financial adviser. Performance is historical, performance may vary, past performance is not necessarily indicative of future performance. This report was produced in conjunction with ABC Bullion NSW.

Trumps Spending Inflation Look Positive For Gold Price But 2011 Downtrend Holds

GOLD PRICE gains of 4.5% overnight Tuesday were all erased by the close of London trade yesterday, with a $20 rebound then fading on Thursday as world stock markets extended their rally following Donald Trump’s surprise victory in the US presidential election.

Japan’s Topix index closed 5.8% higher, reversing the previous day’s losses, and Eurozone equities rose another 0.5% as the start of Thursday’s US trading approached.

Major government bond prices, in contrast, continued to fall amid analyst talk of Trump’s infrastructure and spending plans – as well as inflation – driving 10-year US bond yields above 2.00% for the first time since January.

Gold prices were then trading at $1114, some 12% below this week’s low-point near $1269 per ounce.

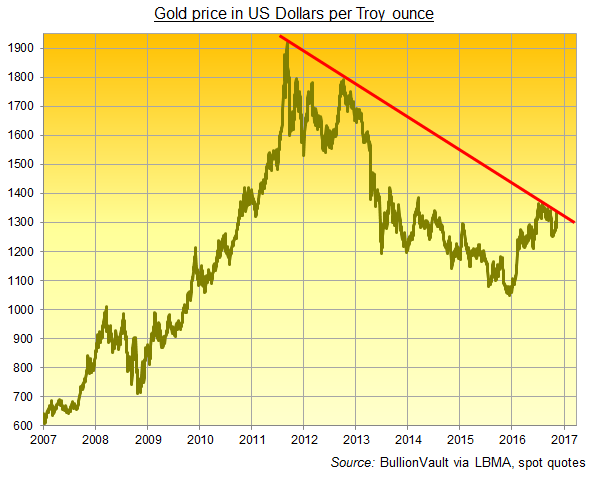
“[Because] the 2011-2016 downtrend has held,” says the latest weekly gold-price analysis from Karen Jones at German financial services giant Commerzbank, “our longer-term bias remains negative.

Chart of gold in Dollars. Source: BullionVault via LBMA, spot quotes

“A weekly close [in the gold price] above $1339 is required for a credible break of the downtrend [but] in order to negate current upside pressure on the market we will need to go sub-$1269” – the low hit just before Trump’s victory began to become clear overnight Tuesday.

Gold prices touched $1270 late yesterday as the market retraced its entire 4.4% jump, before rallying $20 per ounce in Thursday’s Asian and early London trade.

“We believe that Donald Trump’s win is positive for gold,” says the weekly note from specialist analysts Metals Focus, “[but] it is unlikely to be a game-changer.

Repeating its current $1350 forecast for gold between now and New Year – with a high of $1460 predicted for 2017 – “The uncertainty the new president-elect introduces to domestic, foreign and trade policy of the world’s largest economy and military power should continue to encourage interest in safe haven assets,” says Metals Focus.

“If these culminate in renewed turmoil in global markets…the Fed would be forced to respond [perhaps with a] new loosening cycle…and/or a new round of quantitative easing.”

“Within the stock market,” CNBC quotes Thailand-based investment manager and author Marc Faber, “anything that is commodity-related will do well” as a result of Trump’s stated policies – now posted on an offical dotgov US website.

“The obvious trade is to own Russian and Kazakhstan assets,” says Faber, “for the simple reason that Mr.Trump has a more benign view of the world and respects the perspective of foreign leaders.”

Within the United States however, and “with the debt ceiling looming again,” says a precious metals note from strategist Tom Kendall at bullion clearer and market-maker ICBC Standard Bank, “we think there is very little that President-elect Trump will be able to do to inject adrenaline into the economy in 2017.

“In contrast, he certainly will be able to influence business investment decisions and trade policy…more likely negative than positive.

“So there’s a risk that [rather than raising rates] the Fed will have to grapple with both stronger headwinds to growth and rising longer-term inflation expectations.

“That kind of scenario would certainly be positive for gold.”

“For investors willing to accept the incremental volatility,” adds asset management giant Blackrock’s head of asset allocation, Russ Koesterich, “gold is potentially the more leveraged play under a scenario where inflation expectations rise faster than nominal [interest] rates.

“And, as we’ve seen, gold also comes in handy when unexpected things happen.”

Investor demand for shares in giant gold ETF the SPDR Gold Trust (NYSEArca:GLD) yesterday saw another 5.3 tonnes of bullion needed to back the fund.

The third daily inflow of the last 2 weeks, that took the trust’s total holdings to 955 tonnes – a 3-year high when first reached in the immediate aftermath of the UK’s shock Brexit referendum result.


Disclaimer

This publication is for education purposes only and should not be considered either general of personal advice. It does not consider any particular person’s investment objectives, financial situation or needs. Accordingly, no recommendation (expressed or implied) or other information contained in this report should be acted upon without the appropriateness of that information having regard to those factors. You should assess whether or not the information contained herein is appropriate to your individual financial circumstances and goals before making an investment decision, or seek the help the of a licensed financial adviser. Performance is historical, performance may vary, past performance is not necessarily indicative of future performance. This report was produced in conjunction with ABC Bullion NSW.

Gold Price At 'Key Support' Of 200-DMA In 'Quiet Before Storm' Of Trump-Clinton Result

GOLD PRICES held at $1280 per ounce in London dealing as US voters went to the polls Tuesday to choose between Donald Trump and Hillary Clinton, trading above the moving average of the metal’s last 200 days – a key level according to technical chart analysts.

World stock markets held dead-flat after Monday’s 2.5% surge from a record 9 days of losses in the US S&P500 index.

Government bonds also froze, holding interest rates unchanges in quiet trade, while commodity prices slipped again but silver held firmer, trading at $18.29 per ounce.

Shanghai gold prices slipped again, retreating 1% from Friday’s 6-week high against the Yuan as the Dollar consolidated the last 3 sessions’ strong recovery on the FX market.

“Support is at $1278.40 – [the] 200-day moving average,” says a technical analysis of gold price charts from strategist Russell Browne at Canada-based investment and bullion bank Scotia.

“Momentum and [other] indicators have weakened but still remain bullish. I am biased to the upside as long as gold closes above the 200-day MA.”

Chart of gold price with 200-day moving average (DMA)

“It felt like the calm before the storm during Asian trade today,” says the Australian precious metals trading desk of Swiss refining and finance group MKS, also pointing to gold’s 200-day moving average just below $1280 per ounce for immediate technical support.

“We expect muted price action to continue leading into the first poll results. Should Hillary Clinton pull away from Trump, expectations are that $1250 should be supportive for the yellow metal, even more so considering Monday’s weakness having already removed some of the fast money from the market.

“Conversely, should Trump outpace Clinton we expect to see the post-Brexit high of $1375 directly in the firing line.”

“Gold [in October] tested support zone of $1250/1236,” said a chart note Monday from French investment bank and bullion market maker Societe Generale‘s head of technical analysis Stéphanie Aymes, pointing to what was then “the confluence of the 200-day MA and multi-month [2016 upwards] channel.”

Having now “staged a rebound towards crucial graphical resistance of $1307,” says SocGen, “short term [the gold price] is forming a probable double top.

“A move below $1283 will confirm a down move… towards even $1266 [where SocGen pegs the 200-dma]. This will be pivotal support.”

Looking beyond Tuesday’s vote and Wednesday’s result in the Trump-Clinton race for the White House, “Through the US election volatility, we expect that market participants will refocus on the likelihood of a December hike (very high at this point) but more importantly the evolution of interest rates next year,” says a note from Canadian-based TD Securities.

“For now, we still expect that despite a December hike, the Fed will be increasingly conservative next year and leave rates at very accommodative levels.”

Disclaimer

This publication is for education purposes only and should not be considered either general of personal advice. It does not consider any particular person’s investment objectives, financial situation or needs. Accordingly, no recommendation (expressed or implied) or other information contained in this report should be acted upon without the appropriateness of that information having regard to those factors. You should assess whether or not the information contained herein is appropriate to your individual financial circumstances and goals before making an investment decision, or seek the help the of a licensed financial adviser. Performance is historical, performance may vary, past performance is not necessarily indicative of future performance. This report was produced in conjunction with ABC Bullion NSW.

Gold Prices Climb As LBMA Delegates Forecast $1347.40 For 7% Rise In 12 Months Time

GOLD PRICE in US Dollars rose to $1261 per ounce on Tuesday morning as the US Dollar weakens and Asian & European share prices advance while crude oil price is edging back, writes Atsuko Whitehouse at BullionVault.

The Dollar index, which measures the U.S. dollar’s value relative to a basket of currencies, is down 0.25% to 97.64 after recording 7 months high yesterday.

Asian stocks finished up at the end of today’s trading; Nikkei 225 up 0.38%, Hang Seng up 1.52% & Shanghai Composite up 1.40%.

European stocks were also higher this Tuesday lunchtime; FTSE up 0.89%, DAX up 1.10% and CAC up 1.11%.

Crude oil prices made minor gains on Tuesday following an overnight decline, December Brent crude on London’s ICE Futures exchange rose 0.8%, to $51.92 a barrel.

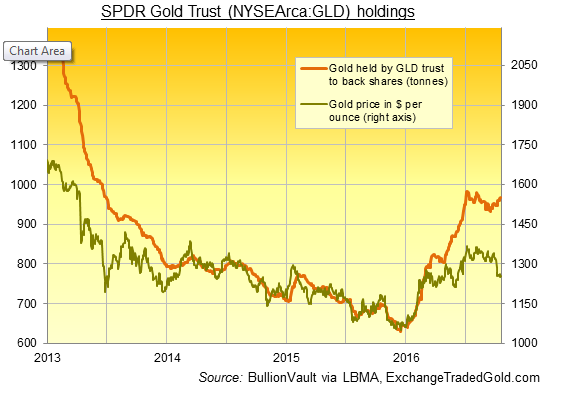
Holdings of SPDR Gold Trust, the world’s largest gold-backed exchange-traded fund (ETF), rose for a third straight session on Monday. They grew 0.18 percent at 967.21 tonnes.

SPDR gold trust (NYSEArca;GLD) holdings

Yesterday, Commerzbank reported on its Commodities Daily, the CFTC statistics on the positioning of speculative market participants showed that, in the last two reporting weeks, net long positions were decimated by around 42%, the most pronounced position reduction in a two week period since the data series began ten years ago.

It went on to say ‘We believe that this will ease the selling pressure from this side, however. What is more, because we assume that gold demand will pick up in Asia in the coming months, we expect the gold price to stabilise and then recover.’

On China’s gold demand, Roland Wang, managing director for China at the World Gold Council (WGC), told Reuters yesterday “We believe we (China) may keep a certain level of about 900-1,000 tonnes of annual consumption (in 2017), but it may face some challenges especially on the jewellery side and also it depends on the price and China’s own economic situation,” on the fringes of an industry conference in Singapore.

Wang also said jewellery traders were seeing “more demand for gold bars since late September” with investors seeking alternate investment options amid China’s housing market curbs.

China’s gold demand reached 984.5 tonnes in 2015 according to WGC’s Gold Demand Trends Full Year 2015.

London Bullion Market Association (LBMA) delegates gather on the last day of its annual conference in Singapore today. Delegates at the conference have forecasted that the average gold price in 12-months time will be $1347.40 per ounce, a 7% rise from today while silver is expected to hit $20.90, nearly a 12% rise.   The last year’s forecast at the LBMA conference in Vienna was $1159.88 for gold.


Disclaimer

This publication is for education purposes only and should not be considered either general of personal advice. It does not consider any particular person’s investment objectives, financial situation or needs. Accordingly, no recommendation (expressed or implied) or other information contained in this report should be acted upon without the appropriateness of that information having regard to those factors. You should assess whether or not the information contained herein is appropriate to your individual financial circumstances and goals before making an investment decision, or seek the help the of a licensed financial adviser. Performance is historical, performance may vary, past performance is not necessarily indicative of future performance. This report was produced in conjunction with ABC Bullion NSW.

Gold Prices Regain Key 200 Day Moving Average After Weak US Jobs Data

GOLD PRICED in US Dollars rose Friday back above its 200-day moving average – a ‘key’ technical level according to several analysts – after new US jobs data came in weaker than expected.

The US jobless rate rose to 5.0% in September according to the Bureau of Labor Statistics’ non-farm payrolls estimate, up one-tenth of a percent from the early 2008 lows reached this summer.

Gold prices rallied to $1261 following the news, $10 above the 4-month low hit as Asian trading began overnight with China still shut for the end of its National Day holiday week.

China’s Shanghai Gold Exchange will re-open Monday to find Dollar gold prices almost 5% below Friday last week.

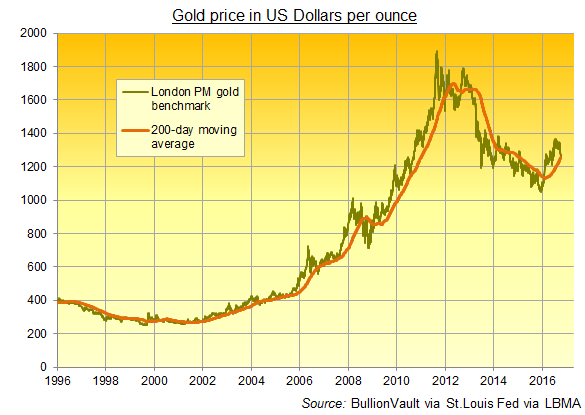
Thursday saw the LBMA Gold Price auction – the global benchmark for physical bullion – fix below its 200-day moving average for the first time since February down at $1254.50 per ounce.

The average of gold’s previous 200 days proved solid support for the 125% gain from late 2008 to autumn 2011.

It then capped gold’s rallies during the last 12 months of its 45% bear market from 2011 to end-2015.

Chart of daily gold price and 200-day moving average

“Needless to say, our forecasts are currently under review,” says Dutch bank ABN Amro’s latest precious metals analysis, having turned bullish in February (when prices had gained 15% from December’s 6-year low) and then raising its price forecasts again in July (when prices hit a 2-year peak at $1375).

“[While] we expect the long-term uptrends to remain in place…gold prices need to bottom out around $1257 and silver prices around $17.10 per ounce, where the 200-day moving averages come in.

“If gold and silver prices break below these levels, this year’s uptrend is over.”

“Next major support is evident at $1258 per ounce,” agrees precious metals analyst Robin Bhar at French investment and bullion market-making bank Societe Generale in London – “the location of the influential 200-day moving average.

“Should this level be broken then this year’s uptrend could be in danger of unravelling.”

But “key will be whether this sell-off prompts bargain hunting and unleashes pent-up physical demand,” Bhar says, adding that while India’s festival and wedding season – peaking with Diwali at the end of October – will come after a slump in year-to-date demand, it also comes after an “above average” monsoon, likely boosting  rural incomes.

“A lower gold price in Indian Rupee terms should also boost demand…[already] evidenced by a much narrower discount to [London wholesale] prices of $1-2 per ounce, compared with a [domestic Indian] discount as high as $75 in July.”

“Our recent visit to the trade fair in Delhi,” said this week’s precious metals note from specialist consultancy Metals Focus, “suggested a level of optimism for the remainder of this year.”

Rising consumer and investor demand will likely cushion gold’s fall, says a new note from US investment bank and bullion market-maker Goldman Sachs’ commodities chief Jeff Currie.

“We would view a sell-off substantially below $1250 as a strategic buying opportunity.”

Gold priced in Sterling meantime spiked more than 5% higher overnight as the Pound spiked down to fresh three-decade lows on the FX market at the start of Asian trading.

Hitting £1048 per ounce, gold priced in GBP then retreated but held above £1015 per ounce to show a small gain for the week and a 17% gain from June 23rd, Brexit Eve.


Disclaimer

This publication is for education purposes only and should not be considered either general of personal advice. It does not consider any particular person’s investment objectives, financial situation or needs. Accordingly, no recommendation (expressed or implied) or other information contained in this report should be acted upon without the appropriateness of that information having regard to those factors. You should assess whether or not the information contained herein is appropriate to your individual financial circumstances and goals before making an investment decision, or seek the help the of a licensed financial adviser. Performance is historical, performance may vary, past performance is not necessarily indicative of future performance. This report was produced in conjunction with ABC Bullion NSW.

Gold Price Slips Despite Vix Volatility Jump Hedges Equity Risk When You Need It

GOLD PRICES slipped back towards yesterday’s 1-week low of $1321 per ounce Tuesday in London even as world stockmarkets fell with commodities and the US Vix volatility index rose once again.

Gold prices rallied late Monday after US Federal Reserve governor Lael Brainard called for further delays to a second Fed rate hike, rather than switching from ‘dove’ to ‘hawk’ ahead of next week’s September meeting and decision.

Asian stockmarkets failed Tuesday to extend Wall Street’s post-Brainard rally, and European equities reversed earlier gains as New York re-opened.

Government bond prices paused their rally after Friday and Monday’s hard sell-off, capping 10-year US Treasury yields at their highest level since the UK’s shock Brexit referendum result of late June at 1.67%.

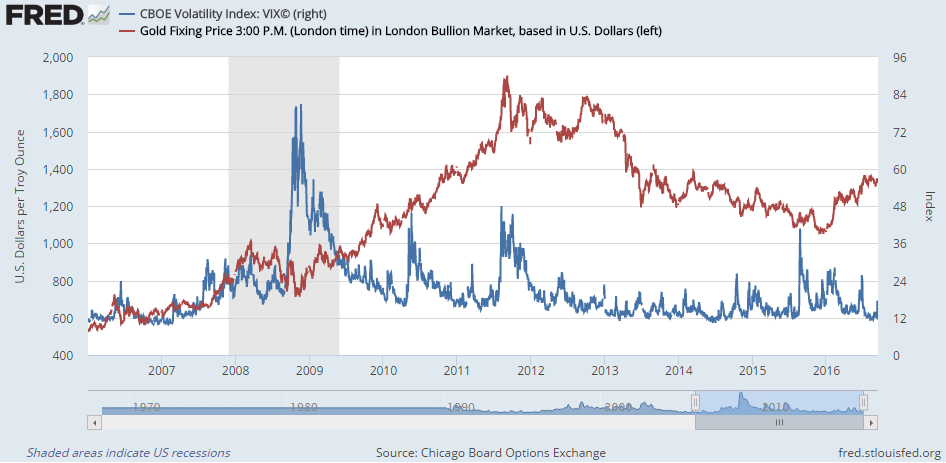
“Wall Street’s ‘fear gauge’ has jumped to the highest since late June,” notes Jonathan Butler, precious metals strategist at Japanese conglomerate Mitsubishi, referring to the ‘Vix’ volatility index of US equity options traded on the CBOE exchange.

“[Yet] gold has failed to benefit much…perhaps indicating that despite an equity market sell-off many investors see gold as susceptible to central bank policy.”

Chart of the Vix volatility index vs gold prices, last 10 years, from St.Louis Fed

Volatility in US equities remains “unsustainably low” says finance giant Blackrock’s head of asset allocation Russ Koesterich. “[So] I would be reluctant…to sell some or all of [my] holdings in the precious metal.

“Changes in the VIX Index – a measure of US equity volatility – explain nearly 20% of the variation in the relative return between gold and the S&P 500 Index,” Koesterich explains, adding that on data back to 1994 “when volatility rose, gold outperformed the S&P 500 price return by roughly 2% on average.”

Most notably, “Gold’s value as a hedge has historically been most pronounced during those periods when you need it the most,” Blackrock’s analysis concludes, with gold beating the S&P 500 three-quarters of the time and by an average 5% when the Vix rose from already high levels.

Volatility today edged higher to read above 16 on the CBOE’s Vix index, just below its 5-year average.

Gold traded 4% below its average daily price since this time in 2011.

With 10-year German Bunds meantime offering 0.02% annual yield to new buyers, the share of Eurozone government debt paying negative rates “has fallen back below 50% after a sell-off triggered by investor disappointment at the European Central Bank’s meeting last week,” says news-wire Reuters.

“That is down from 55% in early July [when] Britain’s vote to leave the European Union posed a threat to global growth.”

The recent sell-off in stocks and bonds marks “a loss of confidence in the ability of central banks…to regenerate inflation,” says Harvard professor – and advocate of banning cash to enable more negative rates – Ken Rogoff, speaking to Bloomberg Television on Tuesday.

“It may be true that global risk sentiment remains broadly stable,” says a gold investing recommendation from French bank Credit Agricole.

“[But] a large part of that stability was due to rising liquidity expectations [thanks to central bank QE and rate cuts] rather than better global growth prospects.”

Disclaimer

This publication is for education purposes only and should not be considered either general of personal advice. It does not consider any particular person’s investment objectives, financial situation or needs. Accordingly, no recommendation (expressed or implied) or other information contained in this report should be acted upon without the appropriateness of that information having regard to those factors. You should assess whether or not the information contained herein is appropriate to your individual financial circumstances and goals before making an investment decision, or seek the help the of a licensed financial adviser. Performance is historical, performance may vary, past performance is not necessarily indicative of future performance. This report was produced in conjunction with ABC Bullion NSW.

Gold Price Breaks Multi Year Highs vs Dollar Euro Pound As Brexit Spooks Fed Bank Of Japan Holds QE And Negative Rates

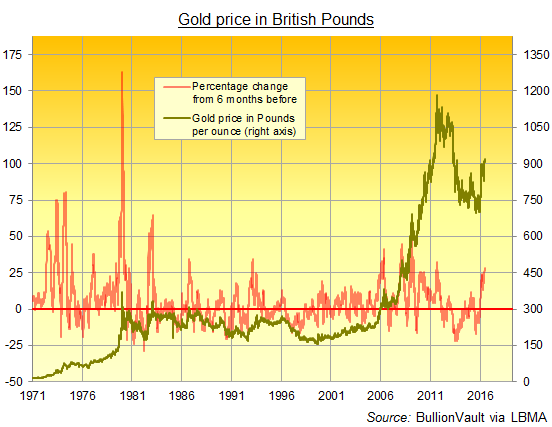
GOLD PRICES jumped against all major currencies bar the Japanese Yen in Asian and London trade Thursday, setting a 22-month high versus the US Dollar after the Federal Reserve held its interest-rate and QE policy unchanged yet again, citing weaker jobs growth, low inflation, and next week’s UK Brexit referendum. The Fed’s inaction was followed by another “no change” decision from the Bank of Japan – now creating and spending ¥6.7 trillion per month ($64bn) on QE asset purchases, while charging commercial banks a negative interest rate of 0.1% per year – and also from the Bank of England in London, which has now held UK rates at 0.5% for 7 years, and owns some 25% of the UK government’s record-high £1.5 trillion ($2trn) of outstanding debt. Tokyo’s Nikkei stock index sank 3% as the Yen rose to September 2014 highs on the FX market. European stock markets fell for the 8th in 12 sessions so far in June, while industrial commodities slipped 0.5% and major government bond prices rose, pushing the yield offered by 10-year German Bunds to new record lows at minus 0.02%. Gold hit $1313 per ounce at the start of London dealing, its highest level since September 2014, but silver held 20 cents shy of start-May’s 15-month high above $18 per ounce. Gold priced against the Euro rose faster than versus any other major currency, adding 3.6% for the week so far to break 3-year highs above €1173 per ounce. Priced in Australian Dollars, gold neared its all-time records of 2011. After Fed voting member Esther George dissented at two meetings running by calling to raise rates, the FOMC was unanimous Wednesday in holding the US central bank’s key interest rate at 0.50%. Only 2 of the 17-member committee now foresee the Fed Funds rate rising to 1.00% by the end of 2016, down from 7 in the April projections and down from 13 last December, when the US central bank finally hiked from 0% after six years at that record low. “[Brexit] was one of the factors [in] today’s decision,” said Fed chair Janet Yellen at her press conference, responding to a question about next Thursday’s UK referendum on quitting the European Union. Gold priced in British Pounds today jumped above £920 per ounce as Sterling retreated from a brief bounce on the currency market following the Fed announcement. Slipping back towards Tuesday’s new 2-month lows at $1.41, the falling Pound has helped drive prices to buy gold 28% higher for UK investors so far in 2016 – the fastest 6-month gain since the global financial crisis peaked with the US debt downgrade, Eurozone crisis and English rioting of summer 2011. Chart of the gold price in British Pounds, last 45 years, via London PM Fix and LBMA Gold Price “Were it not for next week’s Brexit vote, the Dollar would probably have sold off more after last night’s Fed meeting,” reckons a currency note from Dutch bank ING. “Should the UK electorate vote to leave the EU a week today,” says Chinese-owned commodity, FX and bullion-broking ICBC Standard Bank, “we’d expect to see coordinated G7 intervention to stabilise the currency market. “Movements in Sterling post a Brexit result seem very likely to conform to the ‘disorderly’ market conditions that both G7 and G20 central banks and finance ministers don’t want to see.” “It is not [so] much the UK leaving the EU that is troubling,” says a gold recommendation from French investment and bullion bank Natixis – forecasting a Dollar price jump to $1375 per ounce on a Brexit result next week – “but what it means for the future of the European project. “Euroscepticism is clearly on the rise in EU member countries,” Natixis says, pointing to polls saying that 61% of French voters view the EU unfavourably, as do 49% in Spain, 48% in Germany, and 46% in the Netherlands. “The UK has always been…lukewarm to the idea of being part of the EU [but] a Eurozone member leaving (even a small sized member) could create a much bigger shock and announce the beginning of the end of the Euro currency.” Calling gold “an excellent hedge against a local currency debasement,” Natixis advises clients to buy Comex gold options with a strike price of $1375, because the $10 cost would be a “minimal loss…should the UK vote to remain” while offering “important gains” if it leaves. Even in a Bremain scenario, says London bullion-market clearing bank HSBC’s analyst James Steel, “gold would likely be well supported by a number of outside factors” such as the US Fed revising down its expected rate hikes for 2016, plus slow global growth and the coming US presidential election in November. http://blogs.barrons.com/asiastocks/2016/06/16/gold-has-little-downside-brexit-or-not-says-hsbc/ “These factors may well act to buoy gold regardless of the results of the UK referendum.”

Disclaimer

This publication is for education purposes only and should not be considered either general of personal advice. It does not consider any particular person’s investment objectives, financial situation or needs. Accordingly, no recommendation (expressed or implied) or other information contained in this report should be acted upon without the appropriateness of that information having regard to those factors. You should assess whether or not the information contained herein is appropriate to your individual financial circumstances and goals before making an investment decision, or seek the help the of a licensed financial adviser. Performance is historical, performance may vary, past performance is not necessarily indicative of future performance. This report was produced in conjunction with ABC Bullion NSW.

:::
Troy Ounces and Four Nines Gold

In this article we’re going to look at what a troy ounce (the standard measurement for gold) really is, and why you might hear gold referred to as ‘four nines gold’.

Lets start with the troy ounce.

The Troy Ounce is a unit of measurement. The Troy Ounce has for hundreds of years in the Western world been the standard weight measurement for precious metals, and in the present day the major reason it is still in use is to measure the weight and mass of precious metals.

Think of the Troy Ounce as the equivalent to the “barrel” for oil – the standardized way of quoting and monitoring the value of precious metals.

Like a standard ounce it measures weight, although the two are different. A troy ounce of gold does not weigh the same as a standard ounce of butter or cheese.

As a precious metal investor it will help if you understand the difference between the two, yet many would be precious metal investors, and indeed some people who work in the gold industry are not aware that there is a difference between the two.

The “Troy” ounce is part of the troy weights system, which, with the exception of precious metals, is no longer used much. In large part, it was derived from the Roman monetary system. The term ‘troy’ was first attested in 1390, although some think we use the term troy ounces in reference to the French city of TROYES, which in medieval times was an important gold trading post.

In terms of the weight of one troy oz it is equivalent to 31.1034768 grams, whilst 1kg of gold is equal to 32.15 troy oz. A standard ounce weighs only 28.35 grams, so the troy ounce is just under 10% heavier than a regular ounce.

I’ll admit this confused me when I first stepped into the precious metal industry.

The troy ounce today is largely the same as the British imperial troy ounce of 1824-1971, which was adopted as official weight standard for United States coinage by an Act of Congress on May 19, 1828.
All respectable bullion dealers quote their products in terms of troy ounces, so its unlikely you’ll be tripped up when buying or selling precious metals, especially if you are using a company like ABC Bullion, but it does help to know the difference between the two.

For those of you who’d like a short read or two on the difference between troy ounces and regular ounces (called avoirdupois ounces) please click here and / or here.

http://en.wikipedia.org/wiki/Troy_ounce

http://lynncoins.com/troy_ounce.htm

The knowledge contained in those articles won’t change the price of gold but they might help you at the odd trivia contest and make you sound very knowledgeable at the family BBQ.

Why Four Nines?

The other subject we are covering in this edition of bullion university is the number nine, and specifically, why gold is often referred to as ‘four-nines’.

It all comes down to international standards. The number 9 is important because investment grade metals are refined to international purity standards.  For gold, the current purity standard for retail bars is 99.99%.

Note that is possible to create a 99.9999% pure gold bar or coin (apparently the Royal Canadian Mint produced a gold coin of this standard), but for the investment market, 99.99% pure gold is the standard.

The convention is to indicate this by stamping bars with “999.9” meaning that the bar or coin contains 999.9 parts of gold for every 1,000 parts metal or in percentage terms 99.99% pure.

As with most industries, they tend to create their own slang, so you may hear a bullion dealer, trader of refiner refer to this type of gold that is 99.99% pure as “four nines gold.”

“Three nines” for silver

For silver, the international standard is 999.0, meaning that the bar or coin contains 999.0 parts of silver for every 1,000 parts metal or in percentage terms 99.9% pure purity.

At this point maybe you’re wondering why there’s no 100% purity precious metal bars or coins?

Why 99.99% and not 100%?
The reason is that when these metals are refined, from mine output or recycling, they are often in a form that is alloyed with base metals (copper, zinc, lead, nickel).

During the refining process it is not practical to remove every last atom of those base metals, although at 99.99% and 99.9% the refiners do come very close.

Note buying precious metals at lower purity than the standard will restrict your ability to sell your metal and receive immediate payment as the dealer may require the metal to be refined.

There is another very important reason to buy physical gold and silver that is either 99.99% or 99.90% pure. And it’s got to do with tax.

You don’t have to pay GST on “four nines” gold, “three nines” silver or 999.5 Platinum that is in bullion form and has a recognized hallmark such as our own ABC Bullion brand or PAMP gold and silver.

I hope this article has enlightened you to the importance oz ounces and nines.

In summary:

1 troz ounce = 31.1 grams

1 kilo = 32.15 troy ounces

999.9 purity = 99.99% pure


Disclaimer

This publication is for education purposes only and should not be considered either general of personal advice. It does not consider any particular person’s investment objectives, financial situation or needs. Accordingly, no recommendation (expressed or implied) or other information contained in this report should be acted upon without the appropriateness of that information having regard to those factors. You should assess whether or not the information contained herein is appropriate to your individual financial circumstances and goals before making an investment decision, or seek the help the of a licensed financial adviser. Performance is historical, performance may vary, past performance is not necessarily indicative of future performance. This report was produced in conjunction with ABC Bullion NSW.

Gold And Superannuation Funds


One of the things that our clients often ask us is whether or not they can buy gold using their superannuation funds, which is understandable, as superannuation is going to be the largest financial asset that many Australians build.

It will be particularly important for Gen-X and Gen-Y Australians, as they will be contributing 9% or more of their salaries every year for their entire working life, with it being very likely that a Gen-X or Gen-Y couple could contribute over one million dollars into superannuation across their working life.

This edition of Bullion University looks at the opportunity for Australians to invest in gold using their superannuation.

What does my super fund invest in today anyway?

Each and every superannuation fund has slight differences, but in general they follow what are called Strategic Asset Allocation (SAA) guidelines, which stipulate the percentage of the portfolio that should be invested, in what the industry considers, growth assets like shares and listed real estate, but also in defensive assets like government bonds and cash.

For most Australians who are in ‘balanced growth’ funds, the split between growth and defensive assets is typically 70% in growth assets and 30% in defensive assets. The following table is instructive in terms of asset allocation for the industry as a whole.

jordan22

In terms of returns, these portfolios had their best year in nearly two decades in 2013, returning over 17% on average. That’s where the good news ended, with the 7 year to end 2013 return only 4.2% per annum, according to data from Chant West.

For reference, that’s barely better than cash in the bank and only marginally ahead of the rate of inflation. This to me would be pretty frustrating considering we are compelled to put over 9% of our money into Superannuation, and the managers get to charge asset based fees, meaning they get a pay rise every time we put money in.

As you’ll see from the graph, the one asset class that has no representation in mainstream portfolios is physical gold. Some portfolios might have a small exposure to a broad commodity basket, but on average it would be fair to say that traditional superannuation funds have a less than 1% exposure to physical gold.

If you want gold in your superannuation fund, you’re going to need to make it happen yourself, or with the help of a licensed financial planner.

How do I get gold into my superannuation fund?

There are three different ways to get gold exposure into your superannuation portfolio.

The first of these is by having exposure to a gold ETF. As I mentioned earlier some of the more traditional funds would probably use ETF’s (or the futures market) when and if they decide to hold a tiny allocation to gold on behalf of the Australians investing in their fund.

If you are working with an adviser or using a specific superannuation platform, it might be possible to buy a gold ETF using that platform, although not everybody in traditional superannuation will be able to do this.

The second way to get gold exposure is via gold mining shares. If you are in a traditional superannuation fund, you will have some exposure already, mostly as a result of the fact that Newcrest mining is a multi-billion dollar enterprise and one of the larger companies listed on the Australian stock exchange.

As a result, you’d have some de-facto exposure to Newcrest and some other gold miners, as Australian superannuation funds have a large allocation to the broader Australian stock market.

If you are working with an adviser or using a specific superannuation platform, it might be possible to buy a gold mining ETF, some specific stocks or gold mining company managed funds, but again this is not something everybody will be able to do.

Finally, if you are looking to buy real physical gold for now the only way to do this is via a Self Managed Superannuation Fund (SMSF).

SMSF’s require a little more work in terms of setting one up, and there are some ongoing obligations in running one, but there are a number of advantages, including the ability to save on fees over the long run, and additional investment flexibility in terms of what you can invest in.

For a longer read on the ability to save money and to broaden your investment options using a SMSF, please read the following two blogs.

http://bestinvestorblog.wordpress.com/2014/02/25/smsfs-afford-greater-investment-flexibility/

http://bestinvestorblog.wordpress.com/2014/03/14/super-do-it-yourself-and-save/

For me personally, the ability to invest in physical gold (as well we as the ability to save money over the long-run) was the major attraction in setting up a SMSF.

I preferred buying and holding physical rather than an ETF because I wanted security of ownership and also didn’t want to pay an ongoing annual management fee (which ETF’s charge even though you don’t see them).

I also preferred physical to gold mining shares (although I do own some) because physical gold is proper wealth protection, whereas gold mining companies, which can be highly profitable, also leave you exposed to a whole range of additional risks, including management and political risks.

Note that my preference for physical gold in my SMSF is in no way meant to disparage gold mining companies (after all without gold miners there’d be no gold industry) nor gold ETF’s, which I think have done a great job in broadening the appeal of gold as an asset class to a wider range of investors.

Should I have gold in my superannuation fund?

We can’t provide financial advice, only education as to the opportunities that precious metal investment offers in the current environment.

Your superannuation, and indeed a broader investment portfolio, is something that should be unique to your needs and wants, with factors like age, income, when you want to retire, family status etc. are all considerations.

For me personally, I’m glad I have a SMSF with a very heavy allocation to precious metals, but that would most definitely not be appropriate for everyone, and it’s not something I would ever recommend.

What I can say though is that its very obvious that superannuation is going to be a major asset that the majority of our clients contribute to and build, so it makes sense to want to maximise that asset, and investing some time in it would seem worthwhile.

Summary

As discussed above, traditional Australian superannuation funds have very little, if any, gold exposure at all, save for some gold mining companies, which would predominantly be shares in Newcrest mining.

It is possible in some instances to own gold ETF’s, gold mining company managed funds or specific gold companies through a traditional superannuation platform, although this is not always the case.

To own physical gold or silver as part of your portfolio, one must have a SMSF, which whilst it involves a little more paperwork, offers a range of benefits to Australian investors, including potential cost savings, and a wider range of investment possibilities, depending on your circumstances.

Finally, whilst this article, like all of the materials we publish is educational in nature only, and does not contain nor purport to contain specific advice, investing some time and effort into maximising your superannuation is a good idea, as it will be a key financial asset for most Australians.

Disclaimer

This publication is for education purposes only and should not be considered either general of personal advice. It does not consider any particular person’s investment objectives, financial situation or needs. Accordingly, no recommendation (expressed or implied) or other information contained in this report should be acted upon without the appropriateness of that information having regard to those factors. You should assess whether or not the information contained herein is appropriate to your individual financial circumstances and goals before making an investment decision, or seek the help the of a licensed financial adviser. Performance is historical, performance may vary, past performance is not necessarily indicative of future performance. This report was produced in conjunction with ABC Bullion NSW.