RSS

What's New

Stay up to date with gold, silver and platinum news, market developments and bullion insights.
Explore our latest articles or browse the archives to revisit the events that have shaped precious metal markets over the years.

Gold Price Breaks Below 'Key' 1233 Level As US Jobless Rate Hits 2007 Low Political Uncertainty Fades

GOLD PRICES erased a near-$10 rally from fresh 7-week lows in London trade Friday lunchtime as new US data put unemployment in the world’s largest economy at a 16-year low.

US payrolls rose by 211,000 in April on the Bureau of Labor Statistics’ first estimate, beating Wall Street forecasts of 190,000 and nudging the unemployment rate down to 4.4%.

Matching the lows of spring 2007 – just before the global financial crisis – that put the US jobless rate at its lowest level since spring 2001, just as the Tech Stock Crash preceded the United States’ prior economic recession.

Bets on the US Federal Reserve hiking its key interest rate at the June meeting jumped to show an 83% likelihood from 68% only a week ago, while the Dollar spiked on the news, before falling hard to set new 6-month lows against the Euro.

The Dollar also retreated against the Japanese Yen, breaking the tight relationship between USD/JPY and gold prices in Dollar terms building since the start of 2016.

With French voters set to elect centrist Emmanuel Macron as President on Sunday, gold priced in Euros fell back to €1120 per ounce – the lowest since start February – as the Yen gold price struggled above 7-week lows.

Silver fell faster, reversing an overnight rally against the falling Dollar to erase almost the last of 2017’s previous 17% gains at $16.33 just after the US non-farm jobs data.

Having retreated from its 6-year downtrend at $1295 per ounce in mid-April, gold meantime fell through what one bullion market-making bank’s technical analysis team had called “an upward channel limit at $1233…[risking] a larger correction” if that gave way.

Chart of spot gold bullion prices with 2011 downtrend and 2017 upchannel

Friday’s 10.30am benchmark gold price auction in London met strong demand at that $1233 level, finally finding a balance between the volume of buying and selling at $1239 per ounce – fully $4 above the average spot-market quote.

“Support now comes in at $1221.60,” reckons the technical analyst on bullion-clearing bank Scotia Mocatta’s New York team, pointing to the 100-day moving average of gold prices.

“I am bearish on gold, targeting the $1200 level.”

Crude oil failed to join a broader rally in commodity prices Friday, negating “all of the gains achieved after OPEC and some non-OPEC countries decided to cut production” last November according to German financial group Commerzbank, which called this week’s “price slide…excessive.

“We expect a stabilisation and countermovement.”

World stock markets meantime edged higher, adding 2.1% to the EuroStoxx 50 index of major European equities ahead of Sunday’s second and final round in the French presidential election.

Latest opinion polls put centrist former investment banker Macron well ahead of anti-Euro candidate Marine Le Pen.

Welcoming Thursday’s vote to repeal Obamacare by the US Congress, “This has really brought the Republican Party together,” said US President Donald Trump.

“As far as I’m concerned, your [health insurance] premiums are going to come down.”

Local election results in the UK meantime showed a further swing to the ruling parliamentary Conservative Party, suggesting to pundits that Prime Minister Theresa May “looks set for a huge landslide in the general election next month.”

Disclaimer

This publication is for education purposes only and should not be considered either general of personal advice. It does not consider any particular person’s investment objectives, financial situation or needs. Accordingly, no recommendation (expressed or implied) or other information contained in this report should be acted upon without the appropriateness of that information having regard to those factors. You should assess whether or not the information contained herein is appropriate to your individual financial circumstances and goals before making an investment decision, or seek the help the of a licensed financial adviser. Performance is historical, performance may vary, past performance is not necessarily indicative of future performance. This report was produced in conjunction with ABC Bullion NSW.
London Fix Price Catches Up With Spot Gold As Stocks Fall Amid Trump Putin Geopolitics


SPOT GOLD PRICES touched new 5-month highs against a falling US Dollar at $1275 per ounce in London on Wednesday, with the LBMA Gold Price benchmark fixing at its highest level since Donald Trump won the US presidential election last November.
European stockmarkets erased an early bounce, but commodities pushed higher with government bond prices.
Silver nudged above $18.40 per ounce in Asian trade overnight, but held shy of last week’s 1-month top 7 cents higher.
Both the giant GLD gold ETF and the SLV silver trust fund added metal as their number of shares in issue grew amid Tuesday’s price jumps, linked by analysts today to the rising geopolitical stand-off between Trump’s White House and Russian president Putin‘s Kremlin over the war in Syria.
Looking at other currencies, gold priced in Yen has gained 3.5% so far in 2017.
The Dollar price of gold has risen 3 times as fast, adding 10.6% since New Year’s Eve.
This morning’s LBMA Gold Price auction in London – the global benchmarking process now regulated in UK law – saw demand rise 20% from the last 3 months’ average at a fixing of $1272.30 per ounce, the highest wholesale gold price since 10 November 2016.
Tuesday’s 3pm benchmarking auction had found zero demand from wholesale market dealers at the opening price of $1265.75, finally achieving a match between supply and demand – aggregated by bullion banks and dealers from their own client and in-house orders – down at $1252.90 per ounce.
Already jumping 1.3% from midday in contrast, live spot quotes for gold bullion were untouched by the drag from the LBMA price – administered since the 2015 demise of the century-old ‘London Fix’ by benchmark specialists IBA – trading $12 higher above the global benchmark as it found a clearing price at 3:04pm.
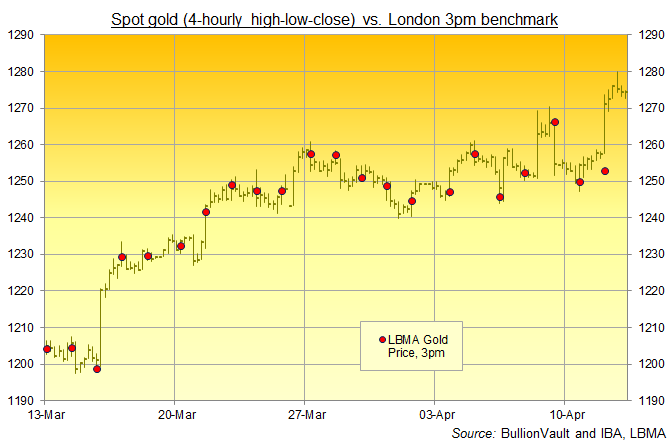
Chart of spot gold prices, 4-hourly high-low-close, versus 3pm LBMA Gold Price benchmark. Source: BullionVault, IBA, LBMA
Over the last month, the 3pm LBMA Gold Price has fixed on average 0.30% above the lowest point of London’s afternoon spot trading, and some 0.25% below that 4-hour period’s high.
Tuesday saw the benchmark fix 0.37% beneath the spot market low and fully 1.63% beneath the afternoon spot high at $1273.69 per ounce.
Blaming a worsening lack of market-maker liquidity thanks to ever-stricter regulations, “It’s not just happening in the precious metals markets, it is happening across all commodities,” reckons consultancy CPM Group head Jeff Christian.
“We saw this trend starting in 2001 and in the last 15 to 16 years t has only gotten worse.”
Again this morning, only 5 direct participants out of 13 approved for the LBMA Gold Price entered orders into the auction, with another 8 sitting on the sidelines.
Over-strict regulations were also blamed in February 2016 for an LBMA Silver Price which fixed almost 6% below live spot quotes.
That set a new 6.5-year low for silver prices, even as spot quotes held 7% higher from end-2015.
Tuesday’s gold price jump reflects a “tug-of-war between heightened geopolitical risks and… despite a weak US payroll number last Friday…a strong underlying global economy,” says a note from US investment bank (and LBMA Gold Price participant) Goldman Sachs.
Coming just inside the benchmark Gold Price auction’s tolerance for an imbalance between supply and demand of 10,000 Troy ounces, Tuesday’s quarter-tonne of net selling was bought by all the direct participants, “shared out among [the full 13] equally,” according to the LBMA’s website explainer, “irrespective of whether they entered interest into the auction or not.”
Chinese gold prices also hit their highest rate since early November in Yuan terms on Wednesday, but cut their premium over London quotes to $9 per ounce at the Shanghai PM Fix.
Almost 3 times the historic average, that offered the smallest incentive for new bullion imports to the world No.1 gold consumer nation since immediately after the new year of the Rooster began on the Chinese Lunar calendar at the end of January.

Gold Price Gains in Q1 for 8th Time in 10 Years

GOLD PRICES slipped Friday but headed on the last day of March 2017 for a 7.1% gain versus the US Dollar since New Year’s Eve.

Rising across the first quarter for the 8th time in the last 10 years, gold prices achieved that in just half of the January-to-March periods over the previous four decades to 2007.

Silver price rose harder still, gaining 11.2% in Dollar terms across the first quarter of 2017 to beat all other major assets except emerging-economy stock markets with a London price of $18.06 per ounce on Friday.

Rupee gold prices in India – the No.2 household buyer – have this week held at a small premium over the global benchmark of London quotes inclusive of 10% import duty, says the Hindustan Times, with demand recovering from 2016’s policy-driven slump for the spring Hindu festival of Gudi Padwa.

Gold premiums in Shanghai today slipped below $12 per ounce for the first time since the start of March, but still offered 4 times the typical incentive of the last half-decade to new imports into China – the world’s No.1 mining, importing, consumer and central-bank buying nation.

“Asian gold demand fell 22% in 2016,” said Cameron Alexander, manager of the region’s Precious Metals Demand data at specialist analysts GFMS, now part of the Thomson Reuters group, launching the consultancy’s 50th annual Gold Survey today.

“The region accounts for 80% of global consumption, so it is often important to the price.”

2016 however saw Western investment demand most notably from large money managers rebound, GFMS explained – a point also stressed at Thursday’s launch of the new Gold Focus 2017 from competitor analysts Metals Focus.

With physical fabrication demand for jewelry, retail bars, coins and industrial uses falling 18% in 2016, the GFMS report says, gold prices still rose thanks to exchange-traded trust fund investment and especially speculation in derivatives contracts, where traders bet on the future price rather than buying bullion itself.

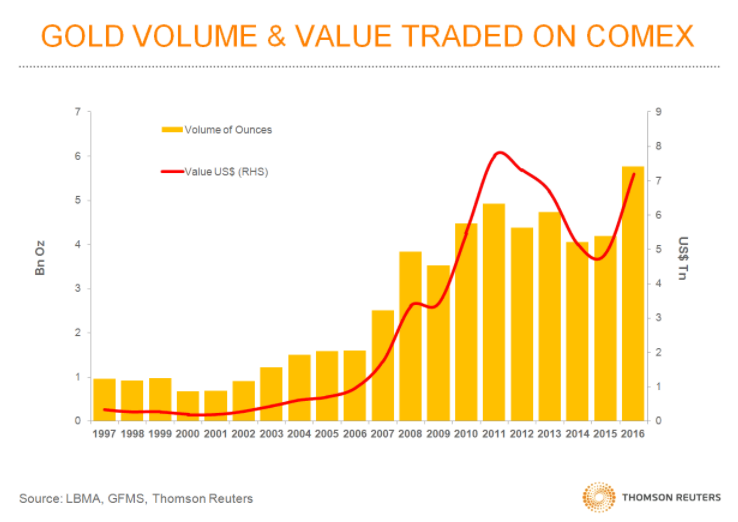
Over the last decade, said Alexander, trading volumes in Comex gold futures have gone from just 10% to now 30% of London’s wholesale ‘over the counter’ market in gold bullion.

Chart of Comex gold futures contracts trading volumes from Thomson Reuters GFMS' fiftieth annual Gold Survey

“China’s voracious appetite for jewelry” in contrast “was more than sated last year,” Alexander went on in today’s GFMS presentation, with a change in fashion to lower-carat, higher profit-margin items likely to dent consumption again in 2017.

But “the decline in China’s investment bar demand has now likely run its course,” he went on.

India’s gold demand also looks set to recover from last year’s 37% plunge in imports according to GFMS, although the imposition of General Sales Tax in mid-2017 poses a short-term challenge to household buying.

As it is, Alexander said Friday, “Consumers are quite happy to purchase gold at current prices,” helped by a stronger Rupee, early forecasts for a good monsoon – key to rural incomes and demand – and economic sentiment as shown by the first-quarter of 2017’s sharp gains in India’s stockmarket indices.

After gold prices averaged $1250 per ounce across 2016, Thomson Reuters now predicts a 0.9% rise for full-year 2017.

Metals Focus’ base case sees an annual average gold price of $1285 but with a possible $1475 high if political or economic stress drives strong new investment demand.

“The [biggest global] risk during the second quarter of this year,” says a note from Chinese-owned bullion clearing and market-making bank ICBC Standard, “is that unresolved arguments over deficit spending [mean] the [Trump] administration fails to get any meaningful tax reform or infrastructure spending bills written, let alone passed.

“That would almost certainly lead to the implied probability of another 25bp rate hike in June falling quickly from current levels around 45%. And that in turn would likely give gold prices the impetus to break up through $1300 again.”


Disclaimer

This publication is for education purposes only and should not be considered either general of personal advice. It does not consider any particular person’s investment objectives, financial situation or needs. Accordingly, no recommendation (expressed or implied) or other information contained in this report should be acted upon without the appropriateness of that information having regard to those factors. You should assess whether or not the information contained herein is appropriate to your individual financial circumstances and goals before making an investment decision, or seek the help the of a licensed financial adviser. Performance is historical, performance may vary, past performance is not necessarily indicative of future performance. This report was produced in conjunction with ABC Bullion NSW.
Gold Prices Down 7 Days in 8 as Fed Rate Hike Risks '1994 Bloodbath' in Bonds, Over-Geared Debt

GOLD PRICES extended their slide Thursday lunchtime in London to 2.5% since Monday – the second such weekly drop in a row – as corporate debt and government bond yields rose again ahead of next week’s Federal Reserve decision on interest rates.

World stock markets held flat overall but commodity prices also dropped hard against the rising US Dollar, while silver hit new 5-week lows of its own, down nearly 7% from end-February’s high to trade below $17.20 per ounce.

The Euro currency – down 3% versus the Dollar from the start of last month – spiked but lost that half-a-cent bounce after the European Central Bank made no changes to its negative interest-rate or QE money creation policies, continuing to buy €80 billion of government debt every month.

Brent crude oil contracts meantime suffered their worst 1-day drop in over a year according to the Financial Times, falling towards $52 per barrel today.

Physical product from 5 out of 10 fields tracked by Reuters has already fallen faster than that benchmark so far in 2017.

Brent now faces “pivotal support at $50” according to a new technical analysis from French investment and bullion market-making bank Societe Generale.

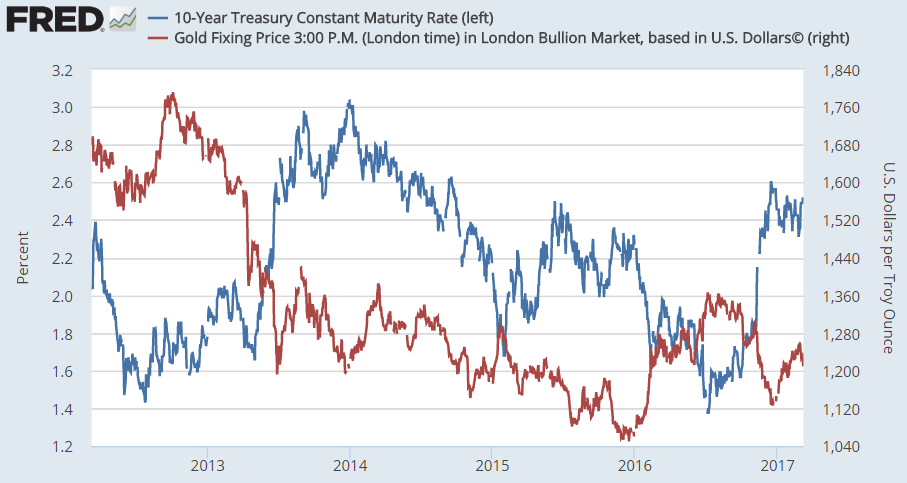
Looking at US interest rates, “The 10-year [Treasury] yield can rise above 3.25% and still [leave the bond’s price] in a bull market,” says SocGen’s global strategist Albert Edwards, warning that next week’s clearly flagged Fed hike to overnight rates risks a repeat of the 1994 bond “bloodbath”.

Chart of 10-year US Treasury yields versus Dollar gold prices

“The US Fed has created another massive credit bubble that will, when it bursts, lay the global economy very low indeed,” says Edwards, predicting that US yields will in time “converge with Japanese and European yields well below zero.”

First however, and with the Fed “having presided over one of the biggest corporate credit bubbles in US history,” the central bank’s sudden 2017 shift to “accelerated” rate hikes “will cause tremors in the Treasury bond markets, forcing rates up.”

“US investment-grade companies are the most leveraged since 2002,” noted Bloomberg columnist Lisa Abramowicz earlier this week, citing data from US investment bank Morgan Stanley that also says corporate cash holdings have sunk to the lowest level relative to obligations since the financial crisis and global economic slump of 2009.

“Leverage ratios typically peak in the wake of an economic downturn, when company incomes drop,” said Abramowicz.

“This time however leverage [has been] climbing as growth accelerates.”

The last time 10-year US Treasury yields touched 3.00% was December 2013.

Gold bullion then traded at $1214 per ounce, down by more than one quarter from the start of that year, which the 10-year yield began at 1.73%.

“Tighter monetary policy is not bullish [for gold prices],” says a new research note from US financial services giant Bank of America Merrill Lynch.,

“[But] inflation and a range of uncertainties – including European elections and protectionism – should support the yellow metal…[to] $1400 by year-end.”

Amongst the key consumer markets on Thursday, “Asian interest [in gold] was generally non-existent today,” said the bullion desk at Swiss refining group MKS Pamp.

“The speculative buying we have been seeing in recent sessions seems to have dried up…and the metal is likely to see further weakness around Friday’s [non-farm US jobs] print should the data follow the strong ADP performance.”

Dollar gold prices have now fallen for 7 in the last 8 sessions, retreating nearly 5% from 27 February’s 3.5-month peak above $1263 per ounce.


Disclaimer

This publication is for education purposes only and should not be considered either general of personal advice. It does not consider any particular person’s investment objectives, financial situation or needs. Accordingly, no recommendation (expressed or implied) or other information contained in this report should be acted upon without the appropriateness of that information having regard to those factors. You should assess whether or not the information contained herein is appropriate to your individual financial circumstances and goals before making an investment decision, or seek the help the of a licensed financial adviser. Performance is historical, performance may vary, past performance is not necessarily indicative of future performance. This report was produced in conjunction with ABC Bullion NSW.
Gold Price Below $1240 as US Bond Yields Hit Near 8-Year High, Silver Firmer

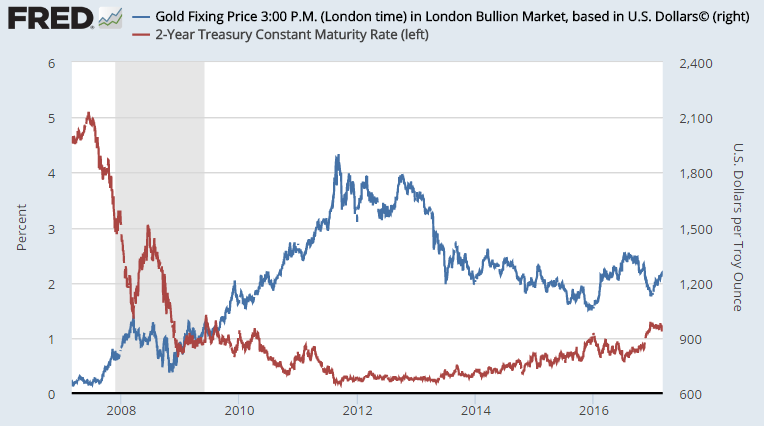
GOLD PRICES fell with the Euro currency to new 1-week lows against the Dollar in London trade on Thursday, dropping back to $1240 for the second day running as government bond prices fell yet again, pushing 2-year US Treasury yields up to the highest level in more than 7 years.

Commodities also dropped, and world stock markets retreated futher from last week’s new record highs, after new data said claims for US jobless benefits fall to the lowest level since 1973.

Betting on US interest rates now sees a 75% chance of the Federal Reserve raising its key rate at this month’s meeting according to data from the Comex exchange.

Two-year US Treasury yields rose to 1.32% according to Bloomberg data, the highest rate offered to new buyers since August 2009.

Chart of 2-year US Treasury bond yields vs. Dollar gold price. Source: St.Louis Fed

Consumer price inflation in the 19-nation Eurozone meantime rose to its fastest headline rate since January 2013 at 2.0% annual last month, data from Eurostat said.

Stripping out the 9.2% annual rise in energy costs however, so-called ‘core’ inflation held unchanged at 0.9%.

Turning “neutral” on the short-term outlook for gold prices, French investment bank Societe Generale’s Robin Bhar says that a “more hawkish Fed [is] offset by political uncertainties in the US and Europe.

“[Silver is] tracking gold movements closely, underpinned by copper strength.”

Silver today retreated only to $18.31 per ounce from last week’s finish at $18.37, holding firmer than gold prices as copper also slipped, down 0.9% for the day and dropping 2.5% from February’s new 21-month highs.

The number of shares in giant silver-backed trust fund the iShares SLV product held unchanged yet again yesterday.

But after 7 trading days of no change, Wednesday saw the creation of 800,000 shares in the giant SPDR Gold Trust (NYSEArca:GLD), the world’s largest ETF trust fund backed by gold.

That required an extra 2.4 tonnes of bullion to back the GLD’s value to shareholders, taking the total to 843.5 tonnes – some 15% below last July’s 3-year high.

Wholesale Chinese gold prices meantime held more than $11 per ounce above the global benchmark of quotes for London settlement, extending the strongest run of Lunar New Year Shanghai gold premiums since 2013.

The Ministry of Finance in India – the world’s no.2 consumer nation behind China – is looking to approve its own domestic spot bullion trading platform sometime in 2017, reports the Economic Times, with a working group convened under its Financial Stability and Development Council now including competitor exchanges the BSE, MCX and NCDEX.

London-based base metals exchange the LME today said that 4 more banks are interested in clearing its forthcoming LMEprecious futures contracts, due to be launched in 2017 in a joint venture with 4 market-making banks, gold vault owner and bullion clearer ICBC Standard Bank, a proprietary trading house, and the mining-backed World Gold Council.

Reuters yesterday said former LME chief Martin Abbott is working with competitor exchange ICE to launch a new base metals trading venue.

Bloomberg last night reported Abbott is working with trading-tech providers Autilla.

Silver Bullion Hits 'Strong $18 Resistance' As Copper Breakout Threatens Stock Market Peak

SILVER BULLION outpaced gold prices yet again on Thursday morning in London, touching what analysts called “strong resistance” at $18.13 per ounce as world stock markets retreated from new all-time highs.

Gold set a 1-week high at $1239 per ounce, but silver bullion recorded its first London benchmarking above $18 since mid-November, immediately after Donald Trump’s victory in the US presidential election.

Global equities meantime touched a new all-time record on the MSCI World index after another record-high Wall Street close. But European stock markets then retreated as the Euro rose for the second day running against the Dollar.

Copper prices edged back but held their “breakout” from the metal’s 5-year downtren as talks to end a strike at BHP Billiton’s giant Escondida mine in Chile were postponed until at least Saturday.

Silver’s price rise, outpacing gold bullion and adding almost $2 per ounce so far in 2017, pushed down the Gold/Silver Ratio of the two precious metals’ prices to 68.3 this morning, falling from the New Year’s peak at 71.5 ounces of silver for each ounce of gold.

Near a 5-month low for gold’s value relative to silver, Thursday morning’s reading held right in the middle of the Gold/Silver Ratio’s trading range of the last 30 years.

Finding half its annual demand from industry, versus less than 10% for gold, silver broke its 5-year price decline relative to the yellow precious metal in mid-2016.

Chart of the Gold/Silver Ratio, London benchmark pricings, 1968-2017. Source: BullionVault via LBMA

“The industrials remain well bid,” says a note from Swiss refining group MKS’s Asian desk, “[with] silver still probing the $18.00 level.

“Strong resistance [is] sitting at $18.13…the July 2016 to Feb 2017 downtrend line.”

Looking at the breakout in copper prices, “Equity prices boomed during the copper bear market,” notes French investment bank Societe Generale’s global strategist Albert Edwards.

“[So] it beggars belief how equity investors have flipped from seeing the deflationary backdrop…as good for equities, to rising bond yields and commodity prices also being good for equities.

“The breadth of base metal price increases is of particular note…with five of the metals up a steamy 30% over the past year and zinc turning in a sparkling 70% performance.”

Gold prices in China rose Thursday to 1-week highs against the Yuan, helping Shanghai premiums – over and above London quotes – hold at $12 per ounce.

More than 4 times the typical incentive to new imports, Thursday’s premium extended the strongest post-Lunar New Year stretch since China’s record gold demand of 2013.

Major government bond prices meantime recovered as equity markets slipped back, rising after yesterday’s strong US inflation data followed Federal Reserve chief Janet Yellen hinting that the next Fed rate hike will come sooner than later.

Betting on US interest-rate futures jumped to put the odds of a March rate hike at 31% on Wednesday, up from 18% the day before.

Betting on forthcoming Fed decisions now sees the odds of a rise in or before May’s meeting as greater than evens – one month sooner than previous market-based forecasts.


Disclaimer

This publication is for education purposes only and should not be considered either general of personal advice. It does not consider any particular person’s investment objectives, financial situation or needs. Accordingly, no recommendation (expressed or implied) or other information contained in this report should be acted upon without the appropriateness of that information having regard to those factors. You should assess whether or not the information contained herein is appropriate to your individual financial circumstances and goals before making an investment decision, or seek the help the of a licensed financial adviser. Performance is historical, performance may vary, past performance is not necessarily indicative of future performance. This report was produced in conjunction with ABC Bullion NSW.

Silver Price Touches 3 Month High Even as SLV Shrinks India Adds 12 5 Tax Gold Reclaims 23rds of Trump Dump

SILVER PRICES hit new 3-month highs and gold rose to the highest in 11 weeks against the Dollar on Thursday as world stock markets stalled near record highs amid news of new US president Donald Trump slamming down the phone on key Pacific ally Australia’s prime minister Malcolm Turnbull.

“He didn’t let diplomatic niceties get in the way of how he felt about [the] refugee policy,” Australia’s ABC News quotes Philip Rucker, the Washington Post journalist who broke the story, referring to what Trump called “a dumb deal” on Twitter.

Trump also today attacked long-time US antagonist Iran, as well as former president Barack Obama’s policy towards the Middle Eastern state.

Silver bullion rose to fresh 12-week highs at $17.70 per ounce as bond yields fell and commodities held flat overall, still some 16% below last summer’s 2-year highs in the wake of the UK’s Brexit referendum shock.

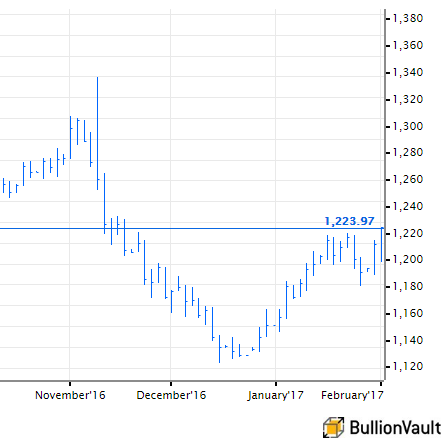
Gold’s jump to $1223 today still left it 11% lower from July’s 2-year high in Dollar terms, but recovered two-thirds of the metal’s sharp post-US election slump.

Chart of US Dollar gold price, last 3 months

Gold priced in Sterling meantime reversed all of last week’s 2.7% drop as the Pound fell 1.5 cents after a vote of ‘no change’ from the Bank of England – now holding £445 billion ($556bn) of QE bond purchases with interest rates at 0.25% despite raising its own 2017 economic forecast dramatically – followed last night’s parliamentary vote to let the Conservative Government trigger Article 50 and proceed with taking the UK out of the European Union.

“Clearly, money managers want to be diversified in these turbulent times,” reckons a note from Canadian brokerage TD Securities, “as markets question Mr.Trump’s ability to deliver strong growth.”

Favored hedge-fund vehicle the giant SPDR Gold ETF (NYSEArca:GLD) yesterday saw a 10-tonne inflow, needed to back extra shares issued to meet investor demand in the trust-fund product – the heaviest creation of new shares since early October.

Seeing only three 10-tonne-plus days in the 3 years starting 2013 – all of them in 2015 – the GLD saw 14 in 2016, helping grow its bullion holdings 28% from the lowest levels since 2008.

Silver’s largest ETF however – the iShares Silver Trust (NYSEArca:SLV) – saw a net outflow of metal as shareholders liquidated stock on 3-month price highs.

With no mention of gold meantime, yesterday’s new budget from the government of India disappointed dealers hoping for a cut in India’s 10% import duty and a higher threshold for purchases to need reporting to the tax authorities.

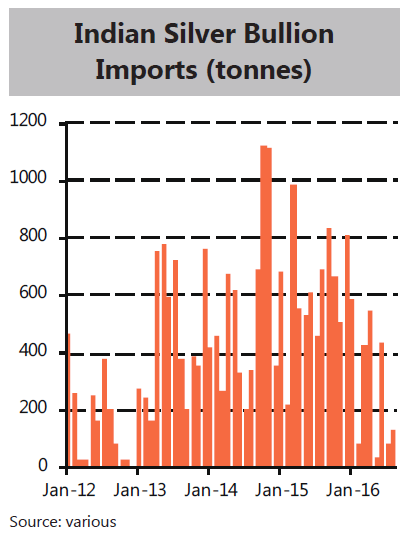
Instead, the new Union Budget added 12.5% tax to all silver bullion, including coins, in what finance minister Arun Jaitley’s department called an “anti-avoidance measure” to follow the shock demonetisation of India’s largest banknotes last November.

Chart of India's silver imports. Source: Metals Focus

As tax and curbs on gold imports rose over the last 5 years, India’s silver investment demand rose more than 4-fold, almost matching the United States’ world-leading private purchases of coin and bar before easing back according to data from specialist analysts Metals Focus.

The long-awaited decision on India’s General Sales Tax – aimed at unifying and simplifying the system, and likely to bring extra value-added tax to jewelry – is yet to come.

Disclaimer

This publication is for education purposes only and should not be considered either general of personal advice. It does not consider any particular person’s investment objectives, financial situation or needs. Accordingly, no recommendation (expressed or implied) or other information contained in this report should be acted upon without the appropriateness of that information having regard to those factors. You should assess whether or not the information contained herein is appropriate to your individual financial circumstances and goals before making an investment decision, or seek the help the of a licensed financial adviser. Performance is historical, performance may vary, past performance is not necessarily indicative of future performance. This report was produced in conjunction with ABC Bullion NSW.
Silver 'Undervalued' vs Gold As Dollar Jumps On Us Jobs In Trump Rally 'Part 3'


SILVER and GOLD PRICES retreated from 12- and 1-week highs respectively against the Dollar lunchtime Wednesday in London, falling as the US currency jumped on news of stronger-than-expected job hiring in January.

The private-sector ADP Payrolls report said US employers added 246,000 net jobs last month, well ahead of the 165,000 forecast by analysts.

World stock markets had already risen sharply after Eurozone manufacturing saw its best month since 2011 and UK manufacturers reported their strongest January in 3 years on the Markit data agency’s PMI surveys.

Copper meantime touched new 2-year highs above $6,000 per tonne after workers at the giant Escondida mine in Chile – owned by BHP Billiton (LON:BLT) – rejected a new wage offer, risking strike action.

With government bond prices falling to nudge market interest rates higher, silver touched $17.62 per ounce for the third time in 2 days, while gol held below yesterday’s top of $1215 per ounce.

That pushed the Gold/Silver Ratio of the two precious metals’ relative prices down to 68.75, the lowest value of gold in terms of silver since mid-December.

The last 10 years’ average stands at 61.55 ounces of silver to 1 ounce of gold, barely changed from the Feb’ 1997 to Jan’ 2007 average.

Chart of the Gold/Silver Ratio, daily London benchmarks, 2005 to 1 Feb 2017

Despite Tuesday’s sharp jump in gold and silver prices, both the SPDR Gold Trust (NYSEArca:GLD) and iShares Silver Trust (NYSEArca:SLV) attracted no new demand for their shares, keeping the quantity of metal held to back the legal trusts’ values unchanged.

The GLD has added metal only twice since Donald Trump’s victory in November’s US election, shrinking instead on 33 of those 51 trading days as shareholders liquidated their positions.

“We’re in Phase III of the Trump rally,” reckons Mohamed El-Erian, chief economic adviser at German insurance and asset-management giant Allianz, writing at Bloomberg.

“Post election…first US stock markets soared, then they traded in a narrow range. Now [they] have entered a period of greater volatility underpinned by a tug of war between the expectation of reflationary policies and the risk of stumbling into stagflation.

“Where we end up will be predominantly a political call.”

Trump’s avowedly “reflationary economic policies” mean that real interest rates – after accounting for the rising cost of living – “may stay favourable to gold,” writes Jonathan Butler at Japanese conglomerate Mitsubishi Corporation in the new LBMA 2017 Forecast competition, pointing to “higher inflation [and] increased fiscal spending.

“[But] we see the potential for silver to outperform gold,” Butler adds – forecasting a 3.7% drop in gold’s average price but a 6.5% gain in silver for 2017 as a whole – “as investors become cognizant of it being under valued on a relative and absolute long-term basis.

“Rising physical offtake will also help silver, especially in the Asian jewellery markets and in the solar photovoltaic sector.”

“Gold is one of the few things you should own,” says UK hedge-fund billionaire Crispin Odey, apparently urging clients to stick with his bearish view of equities, UK government bonds and the Pound Sterling after losing half their money in 2016.


Disclaimer

This publication is for education purposes only and should not be considered either general of personal advice. It does not consider any particular person’s investment objectives, financial situation or needs. Accordingly, no recommendation (expressed or implied) or other information contained in this report should be acted upon without the appropriateness of that information having regard to those factors. You should assess whether or not the information contained herein is appropriate to your individual financial circumstances and goals before making an investment decision, or seek the help the of a licensed financial adviser. Performance is historical, performance may vary, past performance is not necessarily indicative of future performance. This report was produced in conjunction with ABC Bullion NSW.
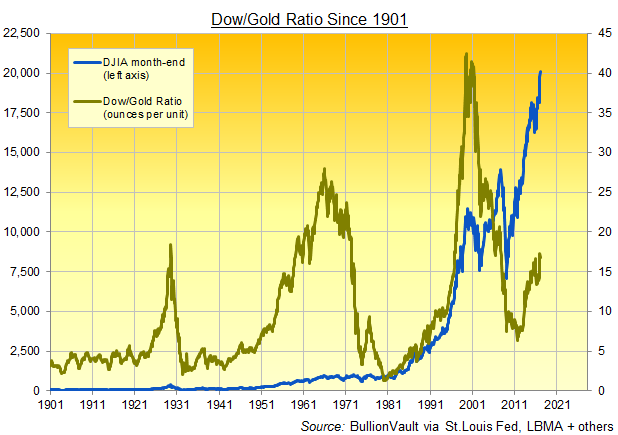
Dow/Gold Ratio Near 9 Year High, "Up, Up!" Says Trump As Dow 20,000 Sees GLD Below 800 Tonnes Of Bullion

GOLD BULLION fell to new 2-week lows in London trade Thursday, as world stock markets pushed higher following the new record close above 20,000 for New York’s Dow Jones Industrial Average.

Rising 26% over the last 12 months, the Dow has accelerated its gains since Donald Trump won November’s election as US president.

Having called the US stock market’s 8-year rise a “big, fat, ugly bubble” in a debate with Hillary Clinton last September, “I’m very proud of it,” said Trump in an interview overnight, also tweeting his approval.

“Now, we have to go up, up, up; we don’t want it to stay there.”

Comparing the relative value of gold against the US stock market, the Dow/Gold Ratio ticked higher as equities rose and bullion fell, rising back towards December’s 9-year high of 17.

Bottoming at barely 2 ounces of bullion per unit of the Dow Jones Industrial Average as the Great Depression hit in the early 1930s, the Dow/Gold Ratio rose steadily following WWII, before making a new low near 1.0 in early 1980 as the stock market sank and gold soared amid the strongest peace-time inflation on record.

Over the following 20 years gold bullion then lost 97% of its value in terms of US equities as measured by the DJIA, before rising six-fold – with the Dow/Gold Ratio falling – to the 2011 peak of the global financial crisis.

Chart of the Dow/Gold Ratio 1901-2017, month-end data, from BullionVault

As gold prices fell below $1200 in the spot market yesterday, bullion needed to back the giant SPDR Gold Trust (NYSEArca:GLD) dropped below 800 tonnes for the first time since March 2016 as shareholders liquidated stock.

Prices on the Shanghai Gold Exchange today fell to 2-week lows versus the Yuan as trading volumes quietened ahead of tomorrow’s start to the week-long Chinese New Year holidays.

The US Dollar meantime pushed both the Euro and British Pound back from better than 1-month highs on the FX market as commodity prices rose with major government bond yields.

Ahead of Friday’s US gross domestic product data for the end of 2016, new figures from the UK today said the world’s 5th largest economy grew its GDP by 2.2% annualized in the fourth quarter, just beating analyst forecasts.

“The Dollar is likely to remain a substantial headwind to further price rises,” says the latest quarterly market data and analysis from specialists Thomson Reuters GFMS, “at least in the first half of 2017.

“Furthermore, there are few indications that physical demand from Asia is set to pick up just yet.”

With European elections from the Netherlands to France, Germany to Italy likely to put the 19-nation Eurozone currency union center stage, however, “There is a growing likelihood of safe haven flows” back into gold bullion GFMS goes on.

Also highlighting possible volatility from US President Trump’s “more unorthodox approach” to politics, GFMS now forecastis an annual average in gold bullion of $1259 per ounce in 2017 – unchanged from 2016’s 2-year high.

Disclaimer

This publication is for education purposes only and should not be considered either general of personal advice. It does not consider any particular person’s investment objectives, financial situation or needs. Accordingly, no recommendation (expressed or implied) or other information contained in this report should be acted upon without the appropriateness of that information having regard to those factors. You should assess whether or not the information contained herein is appropriate to your individual financial circumstances and goals before making an investment decision, or seek the help the of a licensed financial adviser. Performance is historical, performance may vary, past performance is not necessarily indicative of future performance. This report was produced in conjunction with ABC Bullion NSW.

GLD Adds 1 Week Of World Gold Mine Output To Supply Since Trumps Win Price Steadies On Thanksgiving

GOLD PRICES steadied from yesterday’s plunge through $1200 per ounce on Thanksgiving Thursday in London, as quiet trading on the US holiday also saw stocks, bonds, commodities and currencies little changed.

Bullion held to back the value of shares in the SPDR Gold Trust (NYSEArca:GLD) shrank another 13 tonnes Wednesday as gold fell back to its 2013 crash low and investors quit the exchange-traded fund, taking its total holdings to a new 5-month low at 892 tonnes.

The GLD has now shrunk every day since Donald Trump’s US election win a fortnight ago, the longest stretch at 10 sessions running since May 2013.

Net outflows from the GLD – the largest gold ETF – have added 1 weeks’ global gold mining output to supply since November 8.

Chart of GLD gold backing vs spot price. Source: BullionVault via LBMA, ExchangeTradedGold

“Gold prices have dropped below $1200 on the Trump reflation trade,” says a new analysis from Dutch bank ABN Amro’s Georgette Boele, referring to the jump in US bond yields and equity prices.

“We expect the current negative environment to remain in place for gold prices in 2017.

“Investor demand remains the most crucial driver pushing gold prices lower. From an investor point of view there is [now] little reason to hold gold as an investment.”

With gold prices bottoming in December 2015 at $1045 per ounce, ABN’s strategist last year forecast a further drop in gold prices to $900 per ounce by end-2016, writing this January that gold was “no longer a safe haven“.

Gold then began a 30% price rise to July’s post-Brexit peak at $1375, by when Boele had raised ABN’s end-2016 forecast to $1350, predicting in July that “a Trump victory would be bullish for gold prices.”

“I don’t believe it,” meantime says specialist consultancy Metal Focus’ Phil Newman about rumors that the government of India – the world’s No.2 consumer market – may ban gold imports.

“[The rumors] seem to have been started by [India’s] market participants,” he told Kitco News. “Why were they started? We don’t know.”

“Panicked gold traders and jewellers,” The Times of India reported one week ago, “have circulated messages amongst themselves saying the government could ban import of gold for domestic use from early next year.”

The rumors – widely reported since last week by global news-wires – followed the Modi administration’s shock demonetisation of India’s largest banknotes, forcing a cash crunch that has halted business across the nation as people queue outside its banks to transfer their 500 and 1000 Rupee notes for legal tender.

“What is real is that there has been tremendous uncertainty in the gold and silver market in India,” Kitco quotes Newman at Metals Focus.

Amid the global price drop, investors in Western gold markets “are looking for the white knight of the physical [Asian consumer] market,” Newman adds, “and it is hard to see where it is going to come from.”

Silver prices again outpaced gold on Thursday, holding firmer with a 1.3% loss against the Dollar for this week so far at $16.36 per ounce at lunchtime in London.

The iShares Silver Trust (NYSEArca:SLV) – the world’s largest silver ETF – has shrunk by almost 1% since Monday, liquidating nearly 100 tonnes of bullion by end-Wednesday.

That’s equal to more than 1 day’s global silver mine output.

Disclaimer

This publication is for education purposes only and should not be considered either general of personal advice. It does not consider any particular person’s investment objectives, financial situation or needs. Accordingly, no recommendation (expressed or implied) or other information contained in this report should be acted upon without the appropriateness of that information having regard to those factors. You should assess whether or not the information contained herein is appropriate to your individual financial circumstances and goals before making an investment decision, or seek the help the of a licensed financial adviser. Performance is historical, performance may vary, past performance is not necessarily indicative of future performance. This report was produced in conjunction with ABC Bullion NSW.