GOLD PRICES slipped Tuesday in London’s wholesale market, falling for only the fourth time in 16 trading days as world stock markets, commodities and government bond prices all rose yet again.
The US Dollar extended this week’s rally from 3-month lows on the currency market, pushing the Euro down to $1.19205, a 7-session low.
That held the price of wholesale gold investment bars above €1100 per ounce for French, German and Italian investors, its strongest level for nearly 9 weeks.
China’s Yuan also fell against the Dollar, while Shanghai gold premiums – an indicator of demand and supply inside the world’s No.1 mining, importing and consumer nation – slipped back to $7 per ounce above London quotes.
With only 5 weeks until China’s peak Lunar New Year shopping season, that was near the weakest incentive for new bullion imports since mid-September.
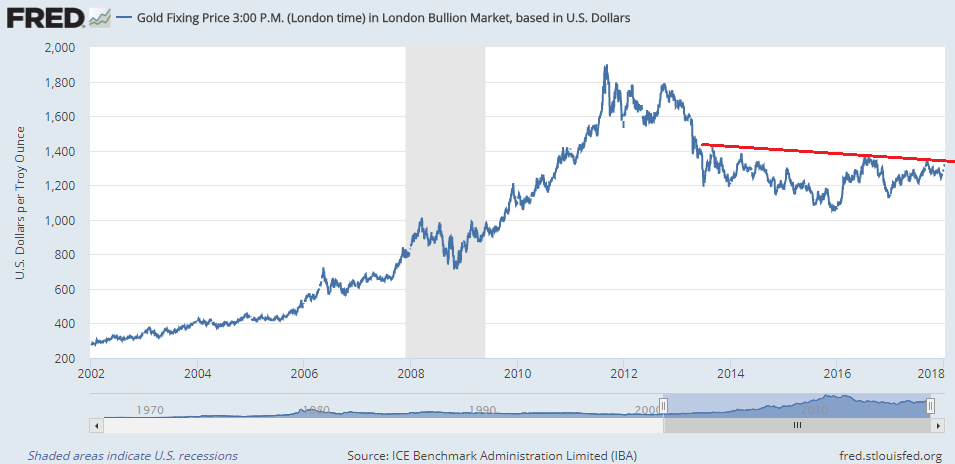
“Gold could finally break out of its four-year trading range if inflation starts to lift globally,” says a new 2018 commodities outlook from former London bullion clearing bank Barclays, tipping mining stocks more broadly as “compelling [on] a strengthening macro backdrop, limited capex, strong earnings momentum…cheap valuation multiples and light [investor] positioning.”
Shorter term, “Gold should see [support] at the recent low of $1315 and the psychological $1300 level below that,” reckons Swiss refining and finance group MKS Pamp’s Asian trading desk.
“On the upside, a break above lasts weeks high of $1324 could see the yellow metal make a move on the September top of $1355.”
The September peak “will be a decisive level for a larger up trend” agrees French investment and bullion market-making bank Societe Generale’s technical analysis team today, calling that $1350-1356 level “the neckline” of a “large Inverted Head and Shoulder pattern.”
This major reversal pattern “forms after a downtrend,” explains StockCharts. “[It] contains three successive troughs with the middle trough (head) being the deepest and the two outside troughs (shoulders) being shallower.

“A clear move above $1356 will mean confirmation of the formation,” says SocGen’s note, “and this will lead to next leg of up move towards $1433/1485 first.”
“It is quite possible that the yellow metal could attempt to hit $1357 in the not too distant future,” says a separate note from Canadian brokerage TD Securities, “[because] investors seem ready to take hefty long gold positions even as equity markets are surging.”
Last week’s positioning data for Comex gold futures and options showed the sharpest jump in speculative bullish betting by money managers, net of that group’s bearish bets, since mid-August.
TD’s Bart Melek gave the best 2017 average gold price forecast in industry body the LBMA’s annual competition last year, predicting $1257 per ounce against the $1256 out-turn at London’s afternoon benchmarking.
He now forecasts a 4.5% rise in gold for 2018, predicting an average annual price of $1313 per ounce.
Near term, “A move toward $1375 is possible should the market believe the US central bank will be gentle in their rate hike signaling,” says TD’s latest note.
Federal Reserve voting member Raphael Bostic of the Atlanta branch yesterday said he sees a need for only 2 further rate rises in 2018, echoing a growing chorus of Fed officials calling for “lower for longer” amid weaker-than-expected inflation data.