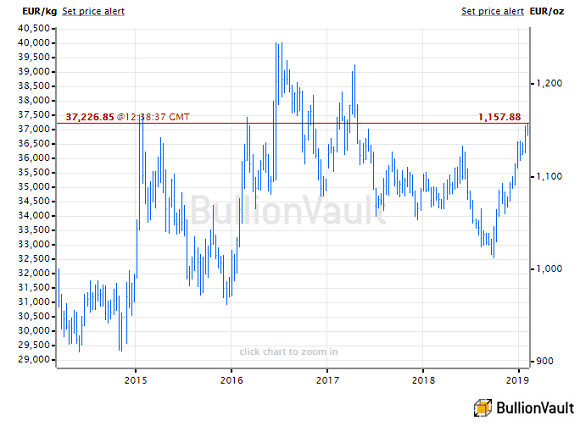
GOLD PRICES slipped to new 1-week lows against most major currencies on Thursday in London, but held on track for the highest close to a calendar quarter in 5 years in US Dollar terms.
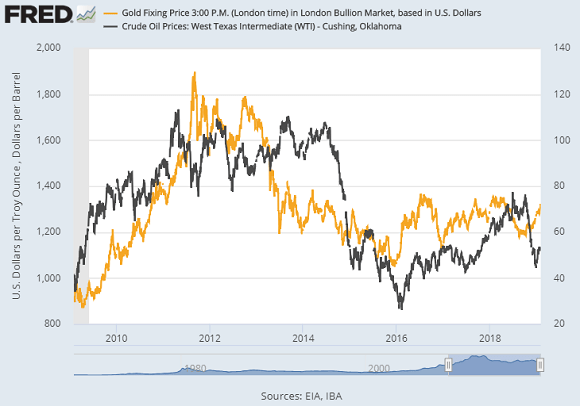
Crude oil retreated again from Tuesday’s new 2018 highs and silver fell harder than gold prices, dropping to $16.24 and losing over 4% for 2018 to date.
Platinum prices erased all but 0.6% of this quarter’s previous $100 per ounce jump to slip below $935.
With London and New York set to shut Friday for the long Easter weekend, gold dropped back to $1324.50 per ounce on the last trading day of March.
That cut the gain from New Year’s Eve to 2.1% but showed a 6.4% rise from end-March 2017 – the strongest annual Q1 gain since 2012.
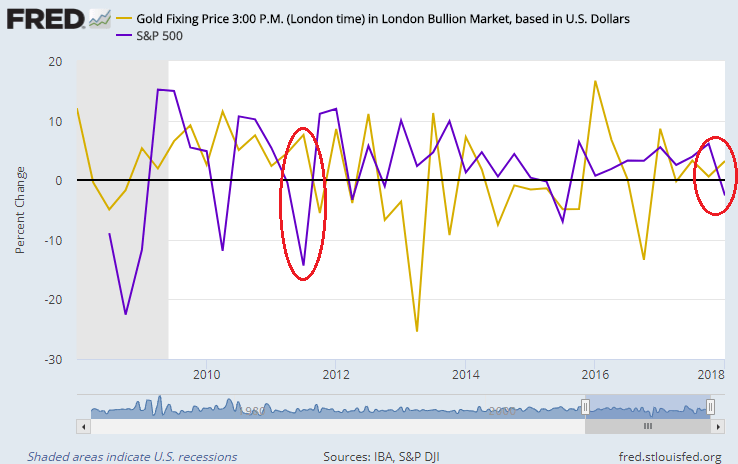
The US stock market in contrast was on track for a 2.5% loss for 2018 to date as New York opened today – its first quarterly drop since mid-2015 and the first time stocks fell as gold rose since Q3 2011.

Asian and European stock markets rallied again on Thursday from this month’s hard sell-off.
But Japan’s Topix index still held on track for a 6.2% quarterly drop while the EuroStoxx 50 neared a 4.3% loss for 2018 to date.
Major government bond prices meantime held onto their recent gains, keeping the interest rate offered by medium-term German Bunds and UK Gilts near the lowest levels since January.
Interbank borrowing costs for 3-month Dollar loans have in contrast now risen 37 trading days in a row according to Bloomberg data, the longest such run since 2005.
Like gold, the benchmark 10-year US Treasury yield has also now risen 3 calendar quarters in succession.
That’s the longest run that US bond yields have risen alongside Dollar gold prices since mid-2006.

With the US Federal Reserve widely expected to follow this month’s rate hike with another in June, “The Fed generally tightens rates until something breaks,” says the latest ‘Alternative View’ on global strategy from the always gloomy Albert Edwards at investment bank Societe Generale.
“Since 1950 there have been 13 Fed tightening cycles,” says the SocGen note, citing Gluskin Sheff strategist David Rosenberg, “and 10 of them ended in recession, while the others have often ended in emerging market blow-ups, like the 1994 Mexican Peso crisis.”
Bad loan levels for smaller US banks are “surging” says Edwards. “The breaking point for the economy may come sooner than the Fed and [stockmarket] bulls expect.”
New UK data from the Office for National Statistics meantime said today that British households accumulated more debt than assets in 2017 – the first such negative move in the sector’s net wealth since current records began in 1987.
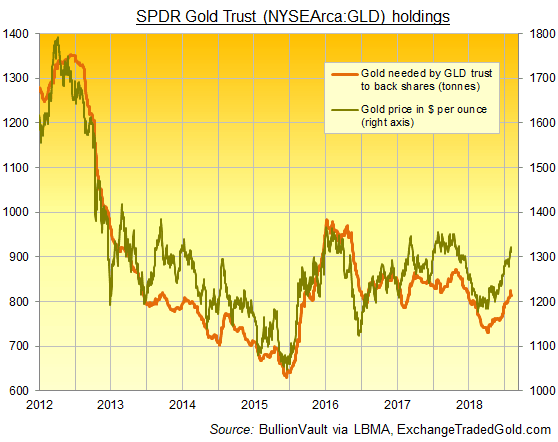
Yesterday’s sharp drop in Dollar gold prices – down over $30 from Tuesday’s 5-week high – saw the giant SPDR Gold Trust (NYSEArca:GLD) hold unchanged in size, needing an 8-session low of 846 tonnes of bullion to back the ETF’s shares in issue.
Yuan gold prices fell overnight in China but less steeply than global Dollar quotes, pushing the premium for metal delivered in Shanghai to almost $11 per ounce – the largest incentive for new imports into the No.1 gold consumer nation of 2018 so far.
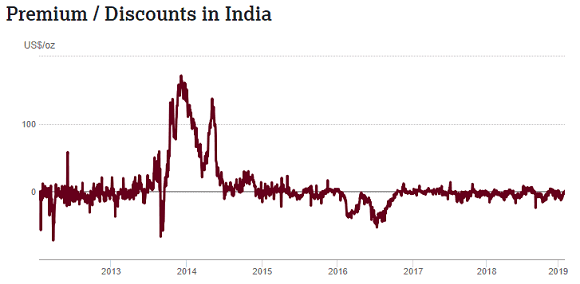
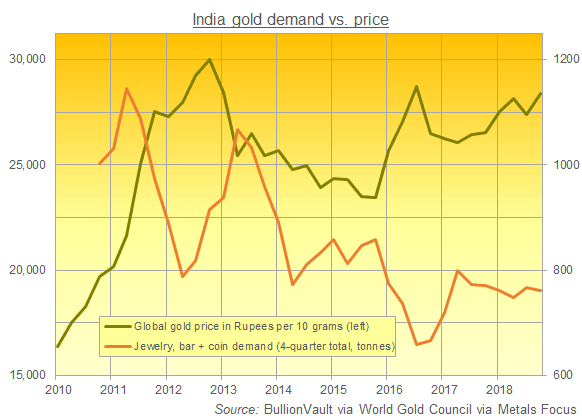
Rupee gold prices in No.2 consumer India also rose relative to global Dollar quotes this week Reuters reports, “on an improvement in demand for weddings and hopes that retail purchases will rise next month” for the Hindu festival of Akshaya Tritiya.
Wholesale bullion prices in the import hub of Ahmedabad rose to $0.50 per ounce after accounting for India’s 10% gold import duty, the largest incentive for new inflows for 2 weeks.