GOLD PRICES headed for their highest Friday close in 11 weeks in US Dollar terms in London today, holding onto most of yesterday’s 2.8% jump to trade above $1223 per ounce as world stock markets bounced from their sharpest drop since February.
Noting this week’s “sea of red spattered across equity investors’ screens”, bullion traders at Swiss refiners and finance group MKS Pamp see “a confluence of multiple factors – US/China trade tensions, US housing market stalling, upcoming mid-terms, narrowing breadth to the equity rally and concern about how far yields will rise.”
As world stock markets fell yet again on Thursday, the volume of Comex gold futures trading jumped 15% above the total number of such contracts now open, according to data from the CME derivatives exchange.
Over the last 12 months, daily trading volumes in Comex gold futures have averaged just 49% of open interest.
Thursday also saw the number of new accounts opened on BullionVault jump to its highest level since 14 August, when gold prices began a steep drop to their lowest Dollar value since January 2017 at $1160 per ounce.
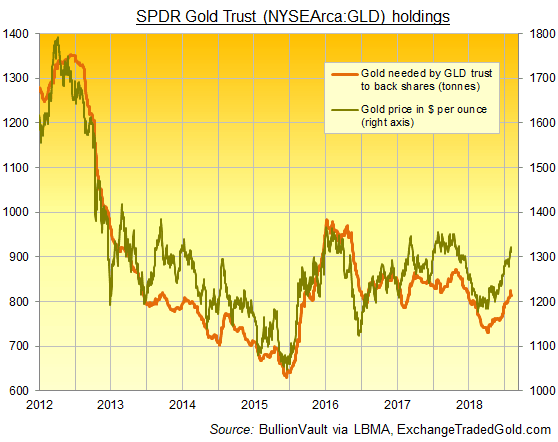
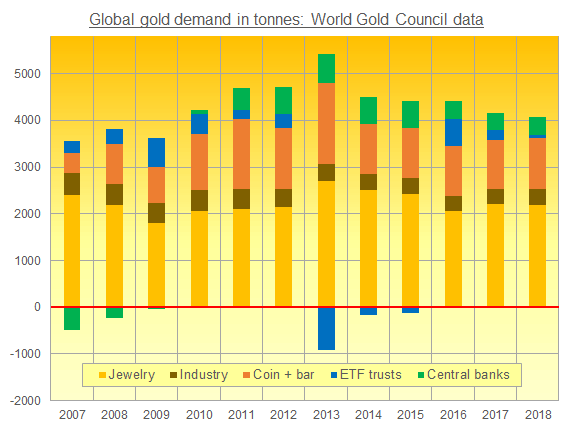
“ETF holdings of gold surged this week after months in decline,” says Bloomberg, noting what has been a 0.4% rise in the amount of bullion needed to back such exchange-traded trust fund structures worldwide.
On a weekly basis however, gold ETFs expanded faster in April 2018 – up 0.7% on BullionVault’s analysis of data collated by the mining industry’s World Gold Council – and grew 3 times faster in June 2016 amid the shock of the UK’s Brexit referendum result.
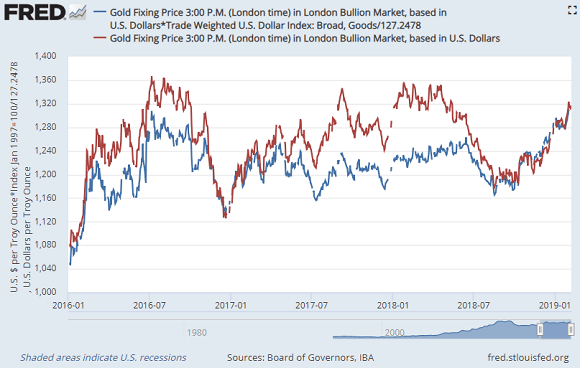
Over on the FX market meantime, the Dollar rallied from new October lows versus the Euro on Friday, and also edged the British Pound back from its strongest level in more than 3 weeks as the UK government published its contingency plans for 28 industries in the “unlikely” event that Britain leaves the European Union with “no deal” next March, covering how it would affect the commercial fishing industry to the cross-border movement of race horses and the domestic UK rail network.
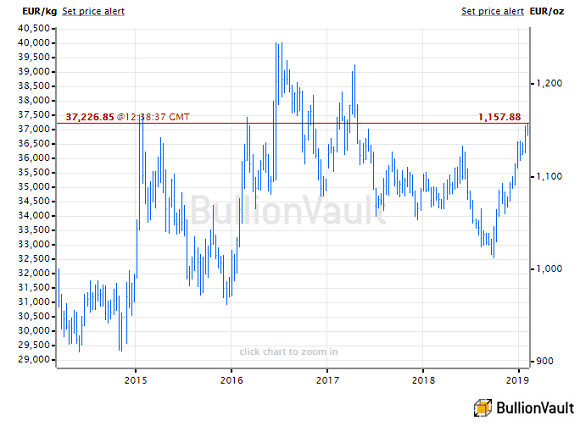
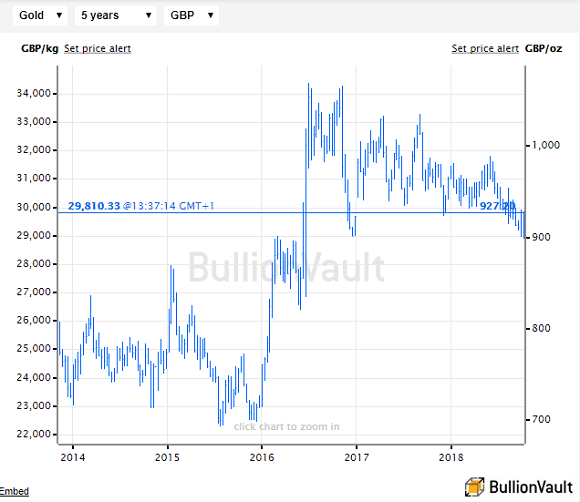
With London’s FTSE100 stock index down 3.6% for the week so far at Friday lunchtime, the gold price in British Pounds per ounce stood 2.8% higher, adding £25 per ounce from Monday’s dip below £900 – its lowest price since before the June 2016 vote.

In the gold-mining sector, shares in Randgold Resources (LON: RRS) added another 3.8% on Friday, taking the London-listed African mining stock 10.0% higher for the week.
Randgold has now risen by one-fifth since it announced plans to merge with No.1 global gold miner Barrick late last month.
That 20% gain matches the rise in Barrick’s stock – up 9.4% on Thursday – with which Randgold’s current shareholders will be paid if the merger is approved next month.
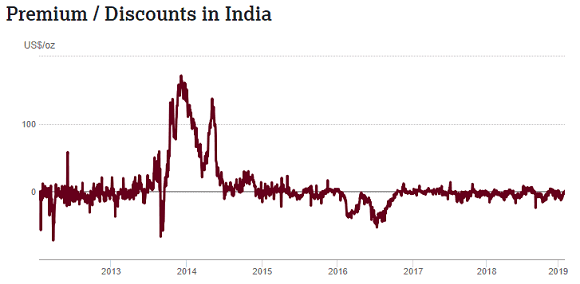
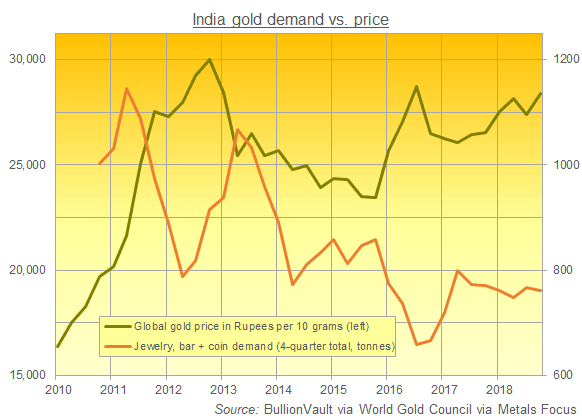
Gold demand in India – the No.2 consumer nation – is picking up, reports Live Mint today, as the Hindu festive season returns following last week’s observance of ‘shradh’ and ahead of next month’s key festival of Diwali.
Year-to-date however, India’s gold bullion imports are running 15% below 2017 levels, say specialist analysts GFMS.
“In October, again imports will rise due to festivals,” reckons former chair of the All India Gems and Jewellery Trade Federation Bachhraj Bamalwa.
With the Yuan meantime slipping 0.7% versus the Dollar since China’s markets closed for last week’s National Day holidays, gold priced in the Chinese currency has risen 2.9%, reaching 6-month highs at Friday’s afternoon fixing in Shanghai.
Shanghai premiums over London quotes however – a measure of how local supply is meeting demand inside the No.1 consumer nation – have retreated to $5 per ounce from the typical $9 level.